Page 47 - Python Data Science Handbook
P. 47
Profiling Memory Use: %memit and %mprun

               Another aspect of profiling is the amount of memory an operation uses. This can be
               evaluated with another IPython extension, the memory_profiler. As with the
               line_profiler, we start by pip-installing the extension:

                   $ pip install memory_profiler
               Then we can use IPython to load the extension:

                   In[12]: %load_ext memory_profiler
               The memory profiler extension contains two useful magic functions: the %memit
               magic (which offers a memory-measuring equivalent of %timeit) and the %mprun
               function (which offers a memory-measuring equivalent of %lprun). The %memit func‐
               tion can be used rather simply:

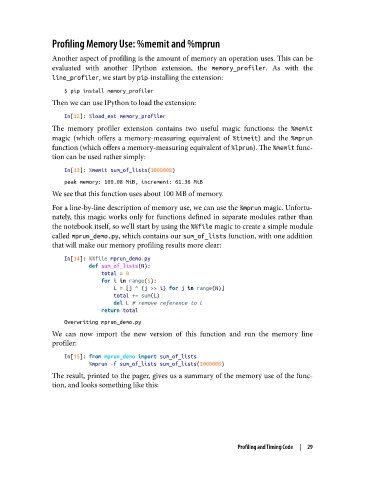
                   In[13]: %memit sum_of_lists(1000000)
                   peak memory: 100.08 MiB, increment: 61.36 MiB
               We see that this function uses about 100 MB of memory.

               For a line-by-line description of memory use, we can use the %mprun magic. Unfortu‐
               nately, this magic works only for functions defined in separate modules rather than
               the notebook itself, so we’ll start by using the %%file magic to create a simple module
               called mprun_demo.py, which contains our sum_of_lists function, with one addition
               that will make our memory profiling results more clear:

                   In[14]: %%file mprun_demo.py
                           def sum_of_lists(N):
                               total = 0
                               for i in range(5):
                                   L = [j ^ (j >> i) for j in range(N)]
                                   total += sum(L)
                                   del L # remove reference to L
                               return total
                   Overwriting mprun_demo.py
               We can now import the new version of this function and run the memory line
               profiler:

                   In[15]: from mprun_demo import sum_of_lists
                           %mprun -f sum_of_lists sum_of_lists(1000000)
               The result, printed to the pager, gives us a summary of the memory use of the func‐
               tion, and looks something like this:


                                                                   Profiling and Timing Code  |  29

