
Page 496 - Python Data Science Handbook
P. 496
(although it may be possible to use a bootstrap approach to estimate this uncertainty).
For this, we must think about generalizing the model.
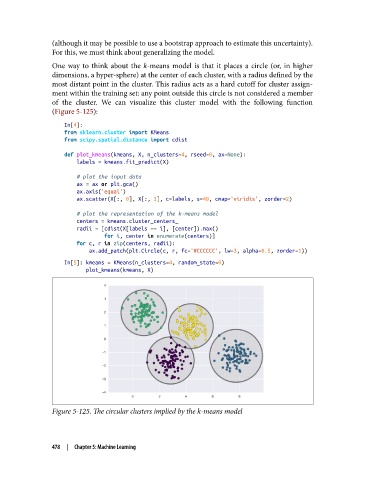
One way to think about the k-means model is that it places a circle (or, in higher
dimensions, a hyper-sphere) at the center of each cluster, with a radius defined by the
most distant point in the cluster. This radius acts as a hard cutoff for cluster assign‐
ment within the training set: any point outside this circle is not considered a member
of the cluster. We can visualize this cluster model with the following function
(Figure 5-125):
In[4]:
from sklearn.cluster import KMeans
from scipy.spatial.distance import cdist
def plot_kmeans(kmeans, X, n_clusters=4, rseed=0, ax=None):
labels = kmeans.fit_predict(X)
# plot the input data
ax = ax or plt.gca()
ax.axis('equal')
ax.scatter(X[:, 0], X[:, 1], c=labels, s=40, cmap='viridis', zorder=2)
# plot the representation of the k-means model
centers = kmeans.cluster_centers_
radii = [cdist(X[labels == i], [center]).max()
for i, center in enumerate(centers)]
for c, r in zip(centers, radii):
ax.add_patch(plt.Circle(c, r, fc='#CCCCCC', lw=3, alpha=0.5, zorder=1))
In[5]: kmeans = KMeans(n_clusters=4, random_state=0)
plot_kmeans(kmeans, X)
Figure 5-125. The circular clusters implied by the k-means model
478 | Chapter 5: Machine Learning