
Page 492 - Python Data Science Handbook
P. 492
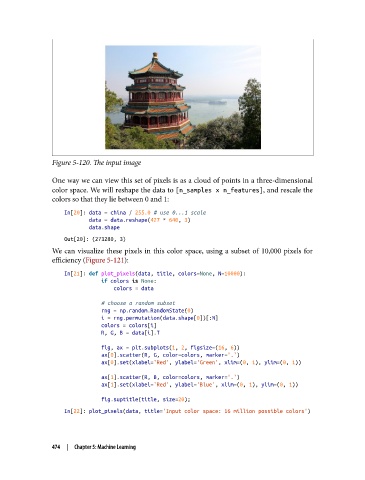
Figure 5-120. The input image

               One way we can view this set of pixels is as a cloud of points in a three-dimensional
               color space. We will reshape the data to [n_samples x n_features], and rescale the
               colors so that they lie between 0 and 1:

                   In[20]: data = china / 255.0 # use 0...1 scale
                           data = data.reshape(427 * 640, 3)
                           data.shape
                   Out[20]: (273280, 3)
               We can visualize these pixels in this color space, using a subset of 10,000 pixels for
               efficiency (Figure 5-121):
                   In[21]: def plot_pixels(data, title, colors=None, N=10000):
                               if colors is None:
                                   colors = data

                               # choose a random subset
                               rng = np.random.RandomState(0)
                               i = rng.permutation(data.shape[0])[:N]
                               colors = colors[i]
                               R, G, B = data[i].T
                               fig, ax = plt.subplots(1, 2, figsize=(16, 6))
                               ax[0].scatter(R, G, color=colors, marker='.')
                               ax[0].set(xlabel='Red', ylabel='Green', xlim=(0, 1), ylim=(0, 1))
                               ax[1].scatter(R, B, color=colors, marker='.')
                               ax[1].set(xlabel='Red', ylabel='Blue', xlim=(0, 1), ylim=(0, 1))
                               fig.suptitle(title, size=20);
                   In[22]: plot_pixels(data, title='Input color space: 16 million possible colors')


               474  |  Chapter 5: Machine Learning