
Page 512 - Python Data Science Handbook
P. 512
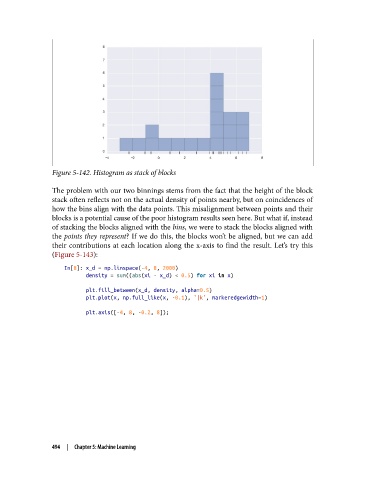
Figure 5-142. Histogram as stack of blocks

               The problem with our two binnings stems from the fact that the height of the block
               stack often reflects not on the actual density of points nearby, but on coincidences of
               how the bins align with the data points. This misalignment between points and their
               blocks is a potential cause of the poor histogram results seen here. But what if, instead
               of stacking the blocks aligned with the bins, we were to stack the blocks aligned with
               the points they represent? If we do this, the blocks won’t be aligned, but we can add
               their contributions at each location along the x-axis to find the result. Let’s try this
               (Figure 5-143):

                   In[8]: x_d = np.linspace(-4, 8, 2000)
                          density = sum((abs(xi - x_d) < 0.5) for xi in x)
                          plt.fill_between(x_d, density, alpha=0.5)
                          plt.plot(x, np.full_like(x, -0.1), '|k', markeredgewidth=1)
                          plt.axis([-4, 8, -0.2, 8]);


               494  |  Chapter 5: Machine Learning