Page 119 - Template Tesis UTM v2.0
P. 119

For each of the tested samples, at least five specimens were tested to obtain the average

                   data.


                                        Figure 3.11   Schematic diagram of SHPB


                        Striker Bar
                                       Incident Bar        Sample           Transmitter Bar

                                                  Gage No. 1     Gage No. 2


                          Time (µs)   Free end                                                  Free end


                        -152        0                 1067      1500   1933                                       3000
                                                            x (mm)

                                          Compressive strain pulse                   Tensile strain pulse


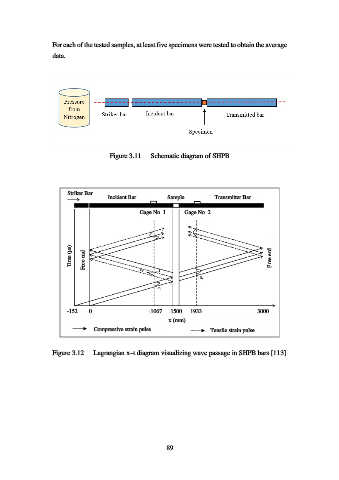
                   Figure 3.12    Lagrangian x–t diagram visualizing wave passage in SHPB bars [113]


                                                           89
   114   115   116   117   118   119   120   121   122   123   124