
Page 118 - Template Tesis UTM v2.0
P. 118
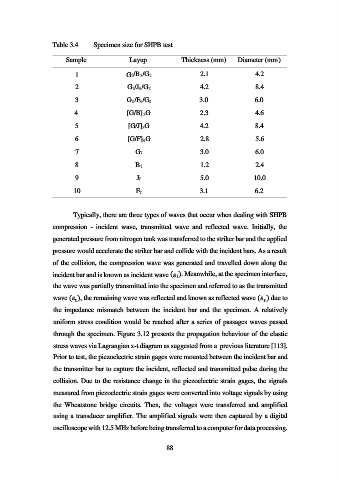
Table 3.4      Specimen size for SHPB test

                        Sample                Layup              Thickness (mm)     Diameter (mm)

                           1                 G2/B3/G2                  2.1                4.2

                           2                 G2/J3/G2                  4.2                8.4

                           3                 G2/F3/G2                  3.0                6.0

                           4                 [G/B]3G                   2.3                4.6

                           5                  [G/J]3G                  4.2                8.4

                           6                  [G/F]3G                  2.8                5.6
                           7                    G7                     3.0                6.0

                           8                    B7                     1.2                2.4

                           9                     J7                    5.0                10.0

                           10                   F7                     3.1                6.2


                           Typically, there are three types of waves that occur when dealing with SHPB

                   compression  -  incident  wave,  transmitted  wave  and  reflected  wave.  Initially,  the

                   generated pressure from nitrogen tank was transferred to the striker bar and the applied
                   pressure would accelerate the striker bar and collide with the incident bars. As a result

                   of the collision, the compression wave was generated and travelled down along the
                   incident bar and is known as incident wave (   ). Meanwhile, at the specimen interface,

                   the wave was partially transmitted into the specimen and referred to as the transmitted
                   wave (   ), the remaining wave was reflected and known as reflected wave (   ) due to


                   the  impedance  mismatch  between  the  incident  bar  and  the  specimen.  A  relatively

                   uniform stress condition would be reached after a series of passages waves passed
                   through the specimen. Figure 3.12 presents the propagation behaviour of the elastic

                   stress waves via Lagrangian x-t diagram as suggested from a  previous literature [113].

                   Prior to test, the piezoelectric strain gages were mounted between the incident bar and
                   the transmitter bar to capture the incident, reflected and transmitted pulse during the

                   collision. Due to the resistance change in the piezoelectric strain gages, the signals
                   measured from piezoelectric strain gages were converted into voltage signals by using

                   the  Wheatstone  bridge  circuits.  Then,  the  voltages  were  transferred  and  amplified
                   using a transducer amplifier. The amplified signals were then captured by a digital

                   oscilloscope with 12.5 MHz before being transferred to a computer for data processing.


                                                           88