
Page 44 - Towards_a_New_Malaysia_The_2018_Election_and_Its_6146371_(z-lib.org)
P. 44
How Malaysia Voted in 2018 29
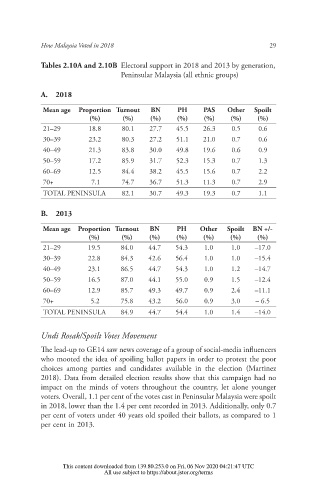
Tables 2.10A and 2.10B Electoral support in 2018 and 2013 by generation,
Peninsular Malaysia (all ethnic groups)
A. 2018
Mean age Proportion Turnout BN PH PAS Other Spoilt
(%) (%) (%) (%) (%) (%) (%)
21–29 18.8 80.1 27.7 45.5 26.3 0.5 0.6
30–39 23.2 80.3 27.2 51.1 21.0 0.7 0.6
40–49 21.3 83.8 30.0 49.8 19.6 0.6 0.9
50–59 17.2 85.9 31.7 52.3 15.3 0.7 1.3
60–69 12.5 84.4 38.2 45.5 15.6 0.7 2.2
70+ 7.1 74.7 36.7 51.3 11.3 0.7 2.9
TOTAL PENINSULA 82.1 30.7 49.3 19.3 0.7 1.1
B. 2013
Mean age Proportion Turnout BN PH Other Spoilt BN +/-
(%) (%) (%) (%) (%) (%) (%)
21–29 19.5 84.0 44.7 54.3 1.0 1.0 –17.0
30–39 22.8 84.3 42.6 56.4 1.0 1.0 –15.4
40–49 23.1 86.5 44.7 54.3 1.0 1.2 –14.7
50–59 16.5 87.0 44.1 55.0 0.9 1.5 –12.4
60–69 12.9 85.7 49.3 49.7 0.9 2.4 –11.1
70+ 5.2 75.8 43.2 56.0 0.9 3.0 – 6.5
TOTAL PENINSULA 84.9 44.7 54.4 1.0 1.4 –14.0
Undi Rosak/Spoilt Votes Movement
e lead-up to GE14 saw news coverage of a group of social-media in uencers
who mooted the idea of spoiling ballot papers in order to protest the poor
choices among parties and candidates available in the election (Martinez
2018). Data from detailed election results show that this campaign had no
impact on the minds of voters throughout the country, let alone younger
voters. Overall, 1.1 per cent of the votes cast in Peninsular Malaysia were spoilt
in 2018, lower than the 1.4 per cent recorded in 2013. Additionally, only 0.7
per cent of voters under 40 years old spoiled their ballots, as compared to 1
per cent in 2013.
This content downloaded from 139.80.253.0 on Fri, 06 Nov 2020 04:21:47 UTC
All use subject to https://about.jstor.org/terms