
Page 411 - Math Smart - 7
P. 411
17.2.5 Pie charts
Some data can be represented In a pie chart. A pie chart is a type of graph that is
in the shape of a circle. It is divided into different parts to represent the quantities
of different items.
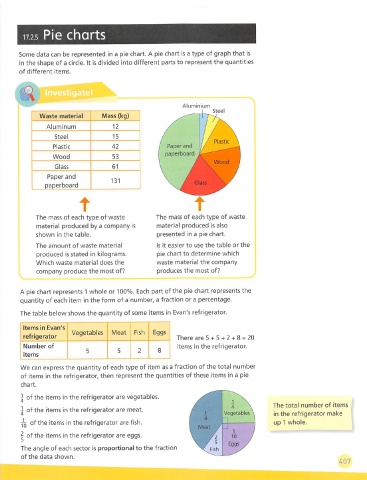
Aluminium
Steel
Waste material Mass (kg)
Aluminum 12
Steel 15
Pastic
Plastic 42 Paper and
paperboard
Wood 53
Glass 61
Paper and
131
paperboard
The mass of each type of waste The mass of each type of waste
material produced by a company is material produced is also
shown in the table. presented in a pie chart.
The amount of waste material Is it easier to use the table or the
produced is stated in kilograms. pie chart to determine which
Which waste material does the waste material the company
company produce the most of? produces the most of?
A pie chart represents 1 whole or 100%. Each part of the pie chart represents the
quantity of each item in the form of a number, a fraction or a percentage.
The table below shows the quantity of some items in Evan's refrigerator.
' Items in Evan's 1
Vegetables Meat Fish Eggs
refrigerator i There are S + 5 + 2 + 8 = 20
1
Number of items in the refrigerator.
5 5 2 o '
items
We can express the quantity of each type of Item as a fraction of the total number
of items in the refrigerator, then represent the quantities of these items in a pie
chart.
1 of the items in the refrigerator are vegetables.
The total number of items
I of the items in the refrigerator are meat.
Vegetable^ in the refrigerator make
of the items in the refrigerator are fish. up 1 whole.
^ of the items in the refrigerator are eggs.
The angle of each sector is proportional to the fraction
of the data shown.
407