
Page 15 - Computing Book 7
P. 15
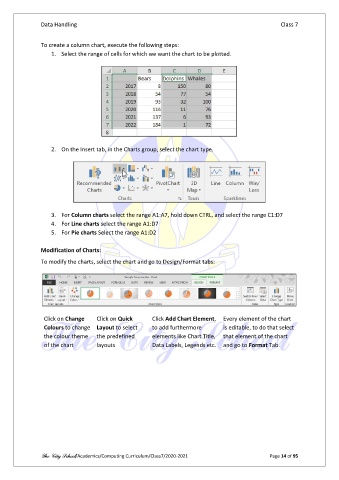
Data Handling                                                                        Class 7


               To create a column chart, execute the following steps:
                   1.  Select the range of cells for which we want the chart to be plotted.


                   2.  On the Insert tab, in the Charts group, select the chart type.


                   3.  For Column charts select the range A1:A7, hold down CTRL, and select the range C1:D7
                   4.  For Line charts select the range A1:D7
                   5.  For Pie charts Select the range A1:D2

               Modification of Charts:

               To modify the charts, select the chart and go to Design/Format tabs:


                Click on Change    Click on Quick     Click Add Chart Element,  Every element of the chart
                Colours to change  Layout to select   to add furthermore       is editable, to do that select
                the colour theme   the predefined     elements like Chart Title,  that element of the chart
                of the chart       layouts            Data Labels, Legends etc.  and go to Format Tab.


               The City School/Academics/Computing Curriculum/Class7/2020-2021                  Page 14 of 95