
Page 44 - Fisika Terapan for Engineers and Scientists
P. 44
244 CHAPTER 8 Conservation of Energy
QUESTION 3: Suppose that the force acting on a particle is given by the function
3
2
F ax bx , where a and b are constants. How do we know that the work done by
x
this force during a round trip from, say, x 1 back to x 1 is zero?
QUESTION 4: Is the equation W U U valid for the work done by every kind of
1 2
force? Is the equation W K K valid for the work done by each individual force
2 1
acting on a particle?
(A) Yes; yes (B) Yes; no (C) No; yes (D) No; no
8.2 THE CURVE OF POTENTIAL ENERGY
If a particle of some given energy is moving in one dimension under the influence of
a conservative force, then Eq. (8.17) permits us to calculate the speed of the particle
as a function of position. Suppose that the potential energy is some known function
U U (x); then Eq. (8.17) states
1
2
E mv U (x) (8.22)
2
or, rearranging,
2
2
v m [E U (x)] (8.23)
Since the left side of this equation is never negative, we can immediately conclude that
the particle must always remain within a range of values of x for which U (x) E.
If U (x) is increasing and the particle reaches a point at which U (x) E, then v 0; that
is, the particle will stop at this point, and its motion will reverse. Such a point is called
a turning point of the motion.
2
2
According to Eq. (8.23), v is directly proportional to E U (x); thus, v is large
wherever the difference between E and U (x) is large. We can therefore gain some
insights into the qualitative features of the motion by drawing a graph of potential
energy as a function of x on which it is possible to display the difference
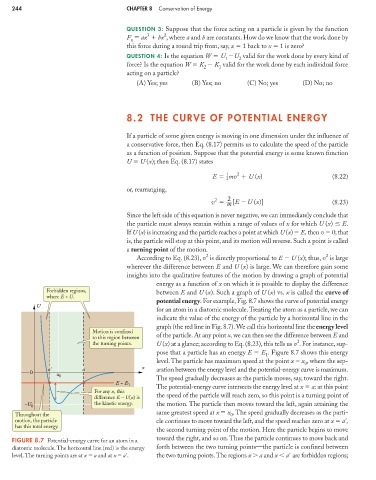
Forbidden regions, between E and U (x). Such a graph of U (x) vs. x is called the curve of
where E < U.
potential energy. For example, Fig. 8.7 shows the curve of potential energy
U
for an atom in a diatomic molecule.Treating the atom as a particle, we can
indicate the value of the energy of the particle by a horizontal line in the
graph (the red line in Fig. 8.7). We call this horizontal line the energy level
Motion is confined
to this region between of the particle. At any point x, we can then see the difference between E and
2
the turning points. U (x) at a glance; according to Eq. (8.23), this tells us v . For instance, sup-
pose that a particle has an energy E E . Figure 8.7 shows this energy
1
level.The particle has maximum speed at the point x x , where the sep-
0
a' a x aration between the energy level and the potential-energy curve is maximum.
0
x 0
The speed gradually decreases as the particle moves, say, toward the right.
E = E 1
The potential-energy curve intersects the energy level at x a; at this point
For any x, this
difference E – U(x) is the speed of the particle will reach zero, so this point is a turning point of
–U 0 the kinetic energy. the motion. The particle then moves toward the left, again attaining the
same greatest speed at x x . The speed gradually decreases as the parti-
Throughout the 0
motion, the particle cle continues to move toward the left, and the speed reaches zero at x a ,
has this total energy.
the second turning point of the motion. Here the particle begins to move
toward the right, and so on.Thus the particle continues to move back and
FIGURE 8.7 Potential-energy curve for an atom in a
diatomic molecule. The horizontal line (red) is the energy forth between the two turning points—the particle is confined between
level. The turning points are at x a and at x a . the two turning points.The regions x a and x a are forbidden regions;