
Page 45 - Fisika Terapan for Engineers and Scientists
P. 45
8.2 The Curve of Potential Energy 245
only the region a x a is permitted.The particle is said to be in a bound U
orbit. The motion is periodic, that is, repeats again and again whenever the par-
ticle returns to its starting point.
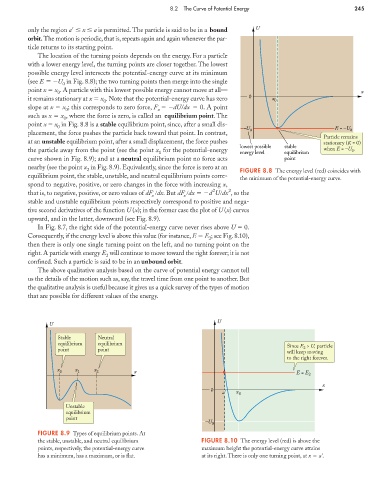
The location of the turning points depends on the energy. For a particle
with a lower energy level, the turning points are closer together. The lowest
possible energy level intersects the potential-energy curve at its minimum
(see E U in Fig. 8.8); the two turning points then merge into the single
0
point x x . A particle with this lowest possible energy cannot move at all—
0 x
it remains stationary at x x . Note that the potential-energy curve has zero 0 x
0 0
slope at x x ; this corresponds to zero force, F dU/dx 0. A point
0 x
such as x x , where the force is zero, is called an equilibrium point. The
0
point x x in Fig. 8.8 is a stable equilibrium point, since, after a small dis-
0 –U E = –U
placement, the force pushes the particle back toward that point. In contrast, 0 0
Particle remains
at an unstable equilibrium point, after a small displacement, the force pushes stationary (K = 0)
lowest possible stable
the particle away from the point (see the point x for the potential-energy when E = –U .
0
1 energy level equilibrium
curve shown in Fig. 8.9); and at a neutral equilibrium point no force acts point
nearby (see the point x in Fig. 8.9). Equivalently, since the force is zero at an
2 FIGURE 8.8 The energy level (red) coincides with
equilibrium point, the stable, unstable, and neutral equilibrium points corre- the minimum of the potential-energy curve.
spond to negative, positive, or zero changes in the force with increasing x,
2 2
that is, to negative, positive, or zero values of dF dx. But dF dx d U dx , so the
x x
stable and unstable equilibrium points respectively correspond to positive and nega-
tive second derivatives of the function U (x); in the former case the plot of U (x) curves
upward, and in the latter, downward (see Fig. 8.9).
In Fig. 8.7, the right side of the potential-energy curve never rises above U 0.
Consequently, if the energy level is above this value (for instance, E E ; see Fig. 8.10),
2
then there is only one single turning point on the left, and no turning point on the
right. A particle with energy E will continue to move toward the right forever; it is not
2
confined. Such a particle is said to be in an unbound orbit.
The above qualitative analysis based on the curve of potential energy cannot tell
us the details of the motion such as, say, the travel time from one point to another. But
the qualitative analysis is useful because it gives us a quick survey of the types of motion
that are possible for different values of the energy.
U
U
Stable Neutral
equilibrium equilibrium Since E > U, particle
point point 2
will keep moving
to the right forever.
x x
x 0 1 2 x E = E 2
x
0
a' x 0
Unstable
equilibrium
point
–U 0
FIGURE 8.9 Types of equilibrium points. At
the stable, unstable, and neutral equilibrium FIGURE 8.10 The energy level (red) is above the
points, respectively, the potential-energy curve maximum height the potential-energy curve attains
has a minimum, has a maximum, or is flat. at its right. There is only one turning point, at x a .