
Page 112 - Physics Form 5 KSSM_Neat
P. 112
Data analysis:
Plot graphs of potential difference, V against current, I for experiment A and experiment B.
Conclusion:
What conclusions can be drawn from both experiments?
Prepare a complete report of experiment A and experiment B.
KEMENTERIAN PENDIDIKAN MALAYSIA
Discussion:
Based on the two graphs of V against I, compare the shapes and gradients of the graphs.
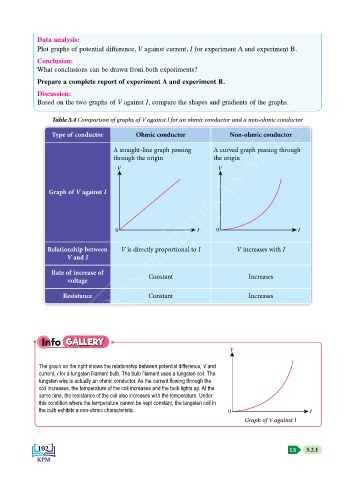
Table 3.4 Comparison of graphs of V against I for an ohmic conductor and a non-ohmic conductor
Type of conductor Ohmic conductor Non-ohmic conductor
A straight-line graph passing A curved graph passing through
through the origin the origin
V V
Graph of V against I
0 I 0 I
Relationship between V is directly proportional to I V increases with I
V and I
Rate of increase of Constant Increases
voltage
Resistance Constant Increases
Info GALLERY
V
The graph on the right shows the relationship between potential difference, V and
current, I for a tungsten filament bulb. The bulb filament uses a tungsten coil. The
tungsten wire is actually an ohmic conductor. As the current flowing through the
coil increases, the temperature of the coil increases and the bulb lights up. At the
same time, the resistance of the coil also increases with the temperature. Under
this condition where the temperature cannot be kept constant, the tungsten coil in
the bulb exhibits a non-ohmic characteristic. 0 I
Graph of V against I
102 LS 3.2.1