
Page 369 - Hall et al (2015) Principles of Critical Care-McGraw-Hill
P. 369
CHAPTER 31: The Pathophysiology of the Circulation in Critical Illness 239
A The pulmonary artery and the left atrium are surrounded by Ppl, so
Thorax absolute values of Ppa and Pla change with respiration. When spontane-
PA ous active inspiration decreases Ppl, pulmonary arterial and left atrial
Catheter Ppl pressures decrease, but the driving pressure of blood flow across the lung
stays the same (Ppa − Pla); when positive-pressure inflation increases
Ppa Pla Ppl, Ppa and Pla increase. Accordingly, it is helpful to record pulmonary
vascular measurements at end expiration when the mode of ventilation
has minimally different effects; even this approach can be confounded
PA
when the patient exerts vigorous respiratory activity. When alveolar
pressure (Pa) exceeds Pla, the true driving pressure for pulmonary blood
flow is Ppa − Pa. One often overlooked adverse effect of positive-pressure
ventilation with high PEEP or high tidal volume is the large increase in
B
dead space (V /V ) when pulmonary blood flow is interrupted by the
t
d
high Pa; not infrequently, alveolar ventilation can actually increase when
tidal volume is reduced in these conditions, causing a paradoxical fall in
. A second consequence of Pa being greater than Pla is an overesti-
Pa CO 2
mation of Ppw; this can be detected when the respiratory fluctuation in
Ppa is much less than that in Ppw. Given these effects of respiration on
71
Q
.
measurements of Ppa and Ppw, it is not surprising that many physicians
err in their interpretation of PAC data. 72,73 Further, PAC use is accom-
A
panied by complications, and it can be argued that the hemodynamic
. data obtained can be deduced by clinical examination, are not helpful
PVR = (Ppa − Pla)/Q
in clinical decision making, or do not improve outcome. 74-76 However,
physicians also err in their clinical evaluations, 77,78 so it seems reasonable
Ppa – Pla to encourage multiple tools to assess the circulation, including echocar-
diographic imaging, dynamic assessments (eg, PP variation, right atrial
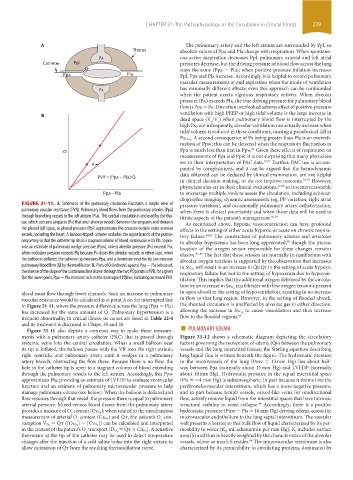
FIGURE 31-11. A. Schematic of the pulmonary circulation illustrates a simple view of pressure variation), and occasionally pulmonary artery catheterization,
pulmonary vascular resistance (PVR). Pulmonary blood flows from the pulmonary arteries (Ppa) when there is clinical uncertainty and when those data will be used to
through branching vessels to the left atrium (Pla). This central circulation is enclosed by the tho- titrate aspects of the patient’s management. 56,79
rax, which contains airspaces (Pa) that abut alveolar vessels. Between the airspaces and thorax is As mentioned above, hypoxic vasoconstriction can have profound
the pleural (pl) space, so pleural pressure (Ppl) approximates the pressure outside extra-alveolar effects in the setting of either acute hypoxic or acute on chronic respira-
vessels, including the heart. A balloon-tipped catheter occludes the upper branch of the pulmo- tory failure. 64,65 The constriction of pulmonary arteries and arterioles
nary artery so that the catheter tip sits in a stagnant column of blood, continuous with Pla, to pro- to alveolar hypoxemia has been long appreciated, though the precise
80
vide an estimate of pulmonary wedge pressure (Ppw), unless alveolar pressure (Pa) exceeds Pla, location of the oxygen sensor responsible for these changes remains
when occlusion pressure exceeds Pla because Pa closes the alveolar vessels; in either case, when elusive. 81-83 The fact that these sensors are normally in equilibrium with
the balloon is deflated, the catheter tip measures Ppa, and a thermistor near the tip can measure alveolar oxygen tensions is supported by the observation that increases
pulmonary blood flow (Q) by thermodilution. B. Plots of Q (ordinate) against Ppa − Pla (abscissa); will result in an increase in Q ˙ s/Q ˙ t in the setting of acute hypoxic
˙
˙
the inverse of the slope of the continuous line drawn through the two PQ points is PVR; for a given in Sv O 2
˙
respiratory failure but not in the setting of hypoxemia due to hypoven-
˙
Q at the lower point, Ppa − Pla increases to A on the interrupted PQ line, indicating increased PVR. tilation. This implies that the additional oxygen delivered by the circula-
˙
equilibrates with low oxygen tensions present
tion by an increase in Sv O 2
blood must flow through fewer channels. Such an increase in pulmonary in open alveoli in the setting of hypoventilation, resulting in no increase
vascular resistance would be calculated as at point A on the interrupted line in flow to that lung region. However, in the setting of flooded alveoli,
in Figure 31-11, where the pressure difference across the lung (Ppa − Pla) the shunted circulation is unaffected by alveolar gas in either direction,
has increased for the same amount of Q ˙ . Pulmonary hypertension is a allowing the increase in Sv O 2 to cause vasodilation and thus increase
frequent abnormality in critical illness; its causes are listed in Table 22-4 flow to the flooded regions. 66
Figure 31-11 also depicts a common way to make these measure- ■
and its treatment is discussed in Chaps. 35 and 38. PULMONARY EDEMA
ments with a pulmonary artery catheter (PAC) that is passed through Figure 31-12 shows a schematic diagram depicting the circulatory
systemic veins into the central circulation. When a small balloon near factors governing the movement of edema (Q ˙ e) between the pulmonary
its tip is inflated, the balloon passes with the VR into the right atrium, vessels and the lung interstitial tissues; the Starling equation describing
right ventricle, and pulmonary artery until it wedges in a pulmonary lung liquid flux is written beneath the figure. The hydrostatic pressure
artery branch, obstructing the flow there. Because there is no flow, the in the microvessels of the lung (Pmv = 12 mm Hg) lies about half-
hole in the catheter tip is open to a stagnant column of blood extending way between Ppa (normally about 15 mm Hg) and LVEDP (normally
through the pulmonary vessels to the left atrium. Accordingly, this Ppw about 10 mm Hg). Hydrostatic pressure in the septal interstitial space
approximates Pla, providing an estimate of LVEDP to evaluate ventricular (Pis = −4 mm Hg) is subatmospheric, in part because it drains into the
function and an estimate of pulmonary microvascular pressure to help peribronchovascular interstitium, which has a more negative pressure,
manage pulmonary edema (see below). When the balloon is deflated and and in part because lymph vessels, valved-like veins for unidirectional
flow resumes through that vessel, the pressure there is equal to pulmonary flow, actively remove liquid from the interstitial spaces that have intrinsic
arterial pressure. Mixed venous blood drawn from the pulmonary artery structural stability to resist collapse. Accordingly, there is a positive
84
); when related to the simultaneous hydrostatic pressure (Pmv − Pis = 16 mm Hg) driving edema across the
provides a measure of O content (Cv O 2
2
2 2
measurement of arterial O content (Ca O 2 ) and Q ˙ t, the patient’s O con- microvascular endothelium to the lung septal interstitium. The vascular
O 2
sumption V ˙ = Q ˙ t ([Cv O 2 ] − [Cv O 2 ]) can be calculated and interpreted wall presents a barrier to this bulk flow of liquid characterized by its per-
). A sensitive meability to water (K ; mL edema/min per mm Hg); K includes surface
2
in the context of the patient’s O transport (D O 2 = Q ˙ t × Ca O 2 f f
thermistor at the tip of the catheter may be used to detect temperature area (S) and thus is heavily weighted by the characteristics of the alveolar
changes after the injection of a cold saline bolus into the right atrium to vessels, where so much S resides. The microvascular membrane is also
84
allow estimation of Q ˙ t from the resulting thermodilution curve. characterized by its permeability to circulating proteins, dominated by
section03.indd 239 1/23/2015 2:06:45 PM