
Page 642 - Hall et al (2015) Principles of Critical Care-McGraw-Hill
P. 642
CHAPTER 52: Acute Lung Injury and the Acute Respiratory Distress Syndrome 461
TABLE 52-6 Phase III Randomized Controlled Clinical Trials Using Lung-Protective Strategies
Mortality in Lower-Tidal- Mortality in Higher- Tidal-
Authors Year Published (Years of Enrollment) Number of Subjects Enrolled Volume Group volume Group p-Value
a
a
Amato et al 7 1998 (1990-1995) 53 38% (45%) b 71% (71%) b <0.0001 (0.37)
Brochard et al 8 1998 (1994-1996) 116 46.5% c 37.9% c 0.39
Stewart et al 9 1998 (1995-1996) 120 50.0% d 47% d 0.72
ARDSNet 3,e 2000 (1996-1999) 861 31.0% f 39.8% f 0.007
a Mortality at 28 days.
b As of hospital discharge.
c Mortality at 60 days.
d Mortality at hospital discharge (up to ~100 days in hospital).
e NHLBI Acute Respiratory Distress Syndrome Clinical Trials Network.
f Mortality before discharge to home without assisted ventilation or as of 180 days, whichever occurred first.
higher PEEP based on static pressure-volume curves of the respiratory the LIP in the group receiving the lung-protective strategy, but examina-
7
system, and recruitment maneuvers) against conventional ventilation. 7 tion of the schematicized curve in Figure 52-8 can be useful for understand-
The strategies tested were based on interpretations of the static ing the strategies for trying to prevent VILI used in all four of the RCTs.
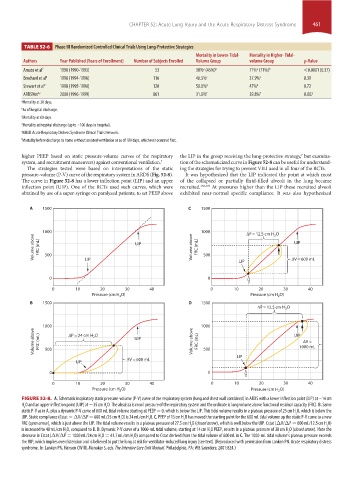
pressure-volume (P-V) curve of the respiratory system in ARDS (Fig. 52-8). It was hypothesized that the LIP indicated the point at which most
The curve in Figure 52-8 has a lower inflection point (LIP) and an upper of the collapsed or partially fluid-filled alveoli in the lung became
inflection point (UIP). One of the RCTs used such curves, which were recruited. 268,269 At pressures higher than the LIP these recruited alveoli
obtained by use of a super-syringe on paralyzed patients, to set PEEP above exhibited near-normal specific compliance. It was also hypothesized
A 1500 C 1500
1000 1000 P = 12.5 cm H 2 O
Volume above FRC (mL) 500 LIP UIP Volume above FRC (mL) 500 LIP V = 600 mL
UIP
0 0
0 10 20 30 40 0 10 20 30 40
Pressure (cm H 2 O) Pressure (cm H 2 O)
B 1500 D 1500
P = 12.5 cm H 2 O
1000 1000
Volume above FRC (mL) 500 P = 24 cm H 2 O UIP Volume above FRC (mL) 500 UIP 1000 mL
V =
V = 600 mL LIP
LIP
0 0
0 10 20 30 40 0 10 20 30 40
Pressure (cm H 2 O) Pressure (cm H 2 O)
FIGURE 52-8. A. Schematic inspiratory static pressure-volume (P-V) curve of the respiratory system (lung and chest wall combined) in ARDS with a lower inflection point (LIP) at ~14 cm
H O and an upper inflection point (UIP) at ∼35 cm H O. The abscissa is recoil pressure of the respiratory system and the ordinate is lung volume above functional residual capacity (FRC). B. Same
2
2
static P-V as in A, plus a dynamic P-V curve of 600 mL tidal volume starting at PEEP = 0, which is below the LIP. This tidal volume results in a plateau pressure of 25 cm H O, which is below the
2
UIP. Static compliance (Cstat = ΔV/ΔP = 600 mL/25 cm H O) is 24 mL/cm H O. C. PEEP of 15 cm H O has moved the starting point for the 600 mL tidal volume up the static P-V curve to a new
2
2
2
FRC (open arrow), which is just above the LIP. The tidal volume results in a plateau pressure of 27.5 cm H O (closed arrow), which is well below the UIP. Cstat (ΔV/ΔP = 600 mL/12.5 cm H O)
2
2
is increased to 48 mL/cm H O, compared to B. D. Dynamic P-V curve of a 1000-mL tidal volume, starting at 14 cm H O PEEP, results in a plateau pressure of 38 cm H O (closed arrow). Note the
2
2
2
decrease in Cstat (ΔV/ΔP = 1000 mL/24 cm H O = 41.7 mL/cm H O) compared to Cstat derived from the tidal volume of 600 mL in C. The 1000-mL tidal volume’s plateau pressure exceeds
2
2
the UIP, which implies overdistension and is believed to put the lung at risk for ventilator-induced lung injury (see text). (Reproduced with permission from Lanken PN. Acute respiratory distress
syndrome. In: Lanken PN, Hanson CW III, Manaker S, eds. The Intensive Care Unit Manual. Philadelphia, PA: WB Saunders; 2001:824.)
section04.indd 461 1/23/2015 2:19:45 PM