
Page 643 - Hall et al (2015) Principles of Critical Care-McGraw-Hill
P. 643
462 PART 4: Pulmonary Disorders
that the UIP represented the point above which the ventilated alveoli group than the others (see Table 52-7). In addition, the protocols dif-
in the lung were overdistended, with a resulting low specific compli- fered in how they dealt with respiratory acidosis due to lower tidal
ance of aerated but overdistended alveoli. Based on such P-V curves, it volumes and permissive hypercapnia. Related to respiratory acidosis,
was suggested that PEEP above LIP should prevent the recruitment- the ARDSNet RCT protocol required increases in ventilator rate as
derecruitment cycles of alveoli, and as such prevent the lung injury the tidal volume was initially decreased, or if the pH fell below normal
resulting from these cycles (“atelectrauma” [see Chap. 51]). Based on this limits. In addition, bicarbonate infusions were allowed, although this
interpretation, tidal volumes that resulted in end-inspiratory (plateau was infrequently required based on the reported on-study variables. In
pressures) below the UIP should decrease alveolar overdistension and the other two earlier RCTs, similar respiratory rate increases were not
thus prevent VILI from this cause. mandated. Possibly as a result of these differences in protocols, there
However, despite the attractiveness of this interpretation of the static were smaller differences in Pa CO 2 and arterial pH between study groups
pressure-volume curve, subsequent reports indicate that the situation is in the ARDSNet RCT compared to the other two RCTs (see Table 52-7).
more complex and that recruitment of alveoli in experimental models and Although the ARDSNet RCT was subsequently criticized for its
in patients with ALI and ARDS extends beyond the pressure at the LIP design in relying on strict ventilator protocols for the higher-tidal-
and continues over a wide range of airway pressures up to 45 cm H O. 270-272 volume group, 273,274 the ARDSNet lower-tidal-volume ventilatory strat-
2
NHLBI ARDS Clinical Trials Network Low-Tidal-Volume Ventilatory Strategy Clinical Trial The egy has become accepted as the basis for standard recommended
NHLBI ARDS Clinical Trials Network conducted the landmark RCT ventilator management of ALI/ARDS patients. This is based both on
that demonstrated the efficacy of lung-protective ventilation (rep- the results of the ARDSNet RCT, but also on the plethora of basic and
resented by low-tidal-volume ventilation) in patients with ALI and clinical studies, as described above and in Chap. 51, relating to VILI
ARDS. This ARDSNet RCT compared a ventilator strategy with lower that support its hypothetical mode of efficacy. Furthermore, based on a
3
tidal volumes designed to limit stretch of the lungs during mechanical recent meta-analysis that demonstrated that a lower-tidal-volume ven-
ventilation with a strategy that utilized traditional larger tidal volumes. tilatory strategy in patients without ALI/ARDS resulted in a decrease in
45
The randomized clinical trial enrolled 861 patients at multiple centers. ALI/ARDS development and a decrease in mortality, lung-protective
Briefly, one study arm received a tidal volume of 6 mL/kg PBW if the ventilation should be considered in all at-risk patients.
Pplat did not exceed 30 cm H O, and tidal volumes of 4 or 5 mL/kg PBW Using Higher Levels of PEEP to Decrease the Risk of VILI There is controversy about whether
2
if Pplat did exceed 30 cm H O (see Table 52-9 for complete details of the higher-than-traditional levels of PEEP can decrease the risk of VILI in
2
protocol of this arm). The other arm received tidal volumes of 12 mL/kg patients with ALI and ARDS. In addition, if higher PEEP is effective against
PBW if the Pplat did not exceed 50 cm H O, and tidal volumes as low as VILI, the question of what level of PEEP should be used clinically remains.
2
4 mL/kg PBW if the Pplat did exceed 50 cm H O. There was a 9% abso- When the pressure-volume relationship is measured in patients with ARDS,
2
lute mortality reduction (22% relative mortality reduction) in the group the LIP (see Fig. 52-8) is in the range of 8 to 15 cm H O. In an earlier CT
7
2
receiving the lower-tidal-volume ventilation strategy (see Table 52-6). study of patients with ARDS, 269,275 the amount of reopening-collapsing tissue
This corresponds to a number needed to treat of ∼11 patients in order to became insignificant only when PEEP reached 20 cm H O (although the
2
prevent one death. Importantly, plasma levels of IL-6 were lower among greatest reduction was seen between 10 and 15 cm H O of PEEP).
2
the 6-mL/kg group, as were the number of organ-failure-free days, indi- However, as noted above, more recent animal and human studies have
cating that the lower tidal volume strategy was associated with a faster shown that the LIP is not the originally hypothesized simple threshold
clearance and/or reduced release of IL-6, a proinflammatory cytokine, above which no further recruitment occurs. Instead, recruitment con-
from the plasma, and less organ dysfunction. tinues from below the LIP to inflation pressures of 45 cm H O. 270,271 In
2
This ARDSNet RCT differed from two prior, smaller studies that other words, there is a broad “inflection zone” from 0 to 45 cm H O over
2
showed no apparent benefit to the lower-tidal-volume strategies (see which there is ongoing recruitment with progressively higher PEEP. The
8,9
Tables 52-6 and 52-7). These differences may have been due to chance implication of these findings is that preventing cycles of recruitment
alone since the earlier studies were of limited sample size, with an associ- and derecruitment in most of the alveoli necessitates that many open
ated lack of statistical power to detect this degree of difference in mor- alveoli will be overdistended. Hence, prevention of injury to alveoli from
tality. Other possible reasons for these differences include the fact that cycles of recruitment-derecruitment will increase the risk of VILI from
the ARDSNet RCT used smaller tidal volumes in the low-tidal-volume overdistention (Fig. 52-9).
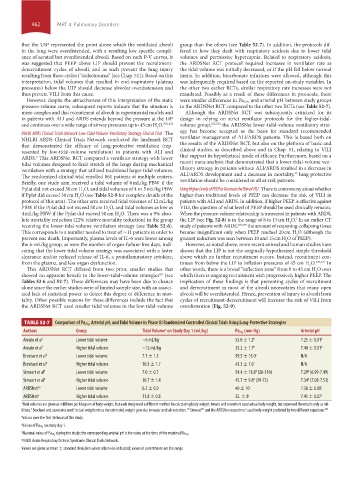
, Arterial pH, and Tidal Volume in Phase III Randomized Controlled Clinical Trials Using Lung-Protective Strategies
TABLE 52-7 Comparison of Pa CO 2
Authors Group Tidal Volume on Study Day 1 (mL/kg) Pa CO 2 (mm Hg) Arterial pH
a
Amato et al 7 Lower tidal volume ~6 mL/kg 55.0 ± 1.2 b 7.25 ± 0.01 b
Amato et al 7 Higher tidal volume ~12 mL/kg 33.2 ± 1.7 b 7.40 ± 0.01 b
Brochard et al 8 Lower tidal volume 7.1 ± 1.3 59.5 ± 15.0 c N/A
Brochard et al 8 Higher tidal volume 10.3 ± 1.7 41.3 ± 7.6 c N/A
Stewart et al 9 Lower tidal volume 7.0 ± 0.7 54.4 ± 18.8 (28-116) 7.29 (6.99-7.49)
d
d
Stewart et al 9 Higher tidal volume 10.7 ± 1.4 45.7 ± 9.8 (29-72) 7.34 (7.08-7.51)
d
d
ARDSNet 3,e Lower tidal volume 6.2 ± 0.9 40 ± 10 c 7.38 ± 0.08 c
ARDSNet 3 Higher tidal volume 11.8 ± 0.8 35. ± 8 c 7.41 ± 0.07 c
a Tidal volumes are given as milliliters per kilogram of body weight, but each study used a different method for calculating body weight: Amato and coworkers used actual body weight, but expressed the results only as mil-
7
liliters. Brochard and associates used “actual weight minus the estimated weight gain due to water and salt retention.” Stewart and the ARDSNet researchers used body weight predicted by two different equations. 222
8
371
3
b Values over the first 36 hours of the study.
c on study day 1.
Values of PaCO 2
d .
Maximal value of PaCO 2 during the study; the corresponding arterial pH is the value at the time of the maximal PaCO 2
e NHLBI Acute Respiratory Distress Syndrome Clinical Trials Network.
Values are given as mean ± standard deviation unless otherwise indicated; values in parentheses are the range.
section04.indd 462 1/23/2015 2:19:45 PM