Page 290 - Clinical Application of Mechanical Ventilation
P. 290

256    Chapter 9


                                            A decreased PaO , an increased P (A-a) O , a decreased PaO /P O , or a decreased
                                                          2
                                                                                                   2
                                                                                                 A
                                                                              2
                                                                                              2
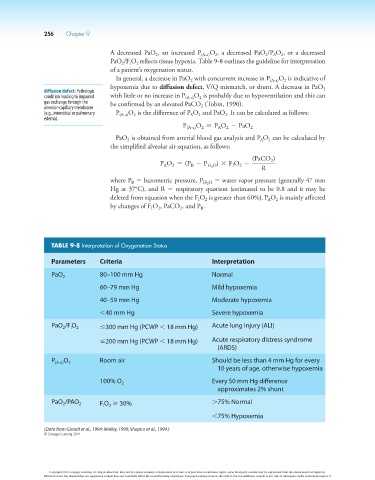
                                            PaO /F O reflects tissue hypoxia. Table 9-8 outlines the guideline for interpretation
                                                  I
                                               2
                                                    2
                                            of a patient’s oxygenation status.
                                             In general, a decrease in PaO  with concurrent increase in P (A-a) O  is indicative of
                                                                                                    2
                                                                      2
                                            hypoxemia due to diffusion defect, V/Q mismatch, or shunt. A decrease in PaO
                      diffusion defect: Pathologic                                                               2
                      condition leading to impaired    with little or no increase in P (A-a) O  is probably due to hypoventilation and this can
                                                                         2
                      gas exchange through the    be confirmed by an elevated PaCO  (Tobin, 1990).
                      alveolar-capillary membrane                        2
                      (e.g., interstitial or pulmonary   P (A-a) O  is the difference of P O  and PaO . It can be calculated as follows:
                                                   2
                                                                                 2
                                                                        2
                                                                      A
                      edema).
                                                                   P (A@a) O = P O - PaO 2
                                                                                 2
                                                                               A
                                                                         2
                                             PaO  is obtained from arterial blood gas analysis and P O  can be calculated by
                                                                                               2
                                                 2
                                                                                             A
                                            the simplified alveolar air equation, as follows:
                                                                                          (PaCO )
                                                            P O = (P - P   H 2 O ) * F O -   R  2
                                                                                      2
                                                                      B
                                                                                   I
                                                                2
                                                             A
                                            where P  5 barometric pressure, P H 2 O  5 water vapor pressure (generally 47 mm
                                                  B
                                            Hg at 37°C), and R 5 respiratory quotient (estimated to be 0.8 and it may be
                                            deleted from equation when the F O  is greater than 60%). P O  is mainly affected
                                                                           2
                                                                                               A
                                                                        I
                                                                                                  2
                                            by changes of F O , PaCO , and P .
                                                                         B
                                                           2
                                                         I
                                                                  2
                        TABLE 9-8 Interpretation of Oxygenation Status
                        Parameters      Criteria                             Interpretation
                        PaO 2           80–100 mm Hg                         Normal
                                        60–79 mm Hg                          Mild hypoxemia
                                        40–59 mm Hg                          Moderate hypoxemia
                                        ,40 mm Hg                            Severe hypoxemia
                        PaO /F O 2      ≤300 mm Hg (PCWP , 18 mm Hg)         Acute lung injury (ALI)
                            2
                               I
                                        ≤200 mm Hg (PCWP , 18 mm Hg)         Acute respiratory distress syndrome
                                                                               (ARDS)
                        P (A-a) O 2     Room air                             Should be less than 4 mm Hg for every
                                                                               10 years of age, otherwise hypoxemia
                                        100% O 2                             Every 50 mm Hg difference
                                                                               approximates 2% shunt
                        PaO /PAO 2      F O  ≥ 30%                           .75% Normal
                            2
                                           2
                                         I
                                                                             ,75% Hypoxemia
                      (Data from Girault et al., 1994; Malley, 1990; Shapiro et al., 1994.)
                      © Cengage Learning 2014


                        Copyright 2013 Cengage Learning. All Rights Reserved. May not be copied, scanned, or duplicated, in whole or in part. Due to electronic rights, some third party content may be suppressed from the eBook and/or eChapter(s).
                      Editorial review has deemed that any suppressed content does not materially affect the overall learning experience. Cengage Learning reserves the right to remove additional content at any time if subsequent rights restrictions require it.
   285   286   287   288   289   290   291   292   293   294   295