
Page 364 - Clinical Application of Mechanical Ventilation
P. 364
330 Chapter 11
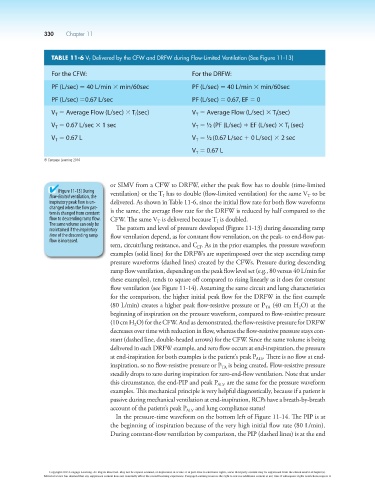
TABLE 11-6 V T Delivered by the CFW and DRFW during Flow-Limited Ventilation (See Figure 11-13)
For the CFW: For the DRFW:
PF (L/sec) 5 40 L/min 3 min/60sec PF (L/sec) 5 40 L/min 3 min/60sec
PF (L/sec) 50.67 L/sec PF (L/sec) 5 0.67, EF 5 0
V 5 Average Flow (L/sec) 3 T (sec) V 5 Average Flow (L/sec) 3 T (sec)
T
I
I
T
V 5 0.67 L/sec 3 1 sec V 5 ½ (PF (L/sec) 1 EF (L/sec) 3 T (sec)
I
T
T
V 5 0.67 L V 5 ½(0.67 L/sec 1 0 L/sec) 3 2 sec
T
T
V 5 0.67 L
T
© Cengage Learning 2014
or SIMV from a CFW to DRFW, either the peak flow has to double (time-limited
(Figure 11-13) During ventilation) or the T has to double (flow-limited ventilation) for the same V to be
flow-limited ventilation, the I T
inspiratory peak flow is un- delivered. As shown in Table 11-6, since the initial flow rate for both flow waveforms
changed when the flow pat-
tern is changed from constant is the same, the average flow rate for the DRFW is reduced by half compared to the
flow to descending ramp flow. CFW. The same V is delivered because T is doubled.
The same volume can only be T I
maintained if the inspiratory The pattern and level of pressure developed (Figure 11-13) during descending ramp
time of the descending ramp flow ventilation depend, as for constant flow ventilation, on the peak- to end-flow pat-
flow is increased.
tern, circuit/lung resistance, and C . As in the prior examples, the pressure waveform
LT
examples (solid lines) for the DRFWs are superimposed over the step ascending ramp
pressure waveforms (dashed lines) created by the CFWs. Pressure during descending
ramp flow ventilation, depending on the peak flow level set (e.g., 80 versus 40 L/min for
these examples), tends to square off compared to rising linearly as it does for constant
flow ventilation (see Figure 11-14). Assuming the same circuit and lung characteristics
for the comparison, the higher initial peak flow for the DRFW in the first example
(80 L/min) creates a higher peak flow-resistive pressure or P (40 cm H O) at the
2
TA
beginning of inspiration on the pressure waveform, compared to flow-resistive pressure
(10 cm H O) for the CFW. And as demonstrated, the flow-resistive pressure for DRFW
2
decreases over time with reduction in flow, whereas the flow-resistive pressure stays con-
stant (dashed line, double-headed arrows) for the CFW. Since the same volume is being
delivered in each DRFW example, and zero flow occurs at end-inspiration, the pressure
at end-inspiration for both examples is the patient’s peak P . There is no flow at end-
ALV
inspiration, so no flow-resistive pressure or P is being created. Flow-resistive pressure
TA
steadily drops to zero during inspiration for zero-end-flow ventilation. Note that under
this circumstance, the end-PIP and peak P ALV are the same for the pressure waveform
examples. This mechanical principle is very helpful diagnostically, because if a patient is
passive during mechanical ventilation at end-inspiration, RCPs have a breath-by-breath
account of the patient’s peak P ALV and lung compliance status!
In the pressure-time waveform on the bottom left of Figure 11-14. The PIP is at
the beginning of inspiration because of the very high initial flow rate (80 L/min).
During constant-flow ventilation by comparison, the PIP (dashed lines) is at the end
Copyright 2013 Cengage Learning. All Rights Reserved. May not be copied, scanned, or duplicated, in whole or in part. Due to electronic rights, some third party content may be suppressed from the eBook and/or eChapter(s).
Editorial review has deemed that any suppressed content does not materially affect the overall learning experience. Cengage Learning reserves the right to remove additional content at any time if subsequent rights restrictions require it.