
Page 365 - Clinical Application of Mechanical Ventilation
P. 365
Ventilator Waveform Analysis 331
Time-Limited Ventilation
80
V (L/min) V = 0.5 L* Flow-Limited Ventilation
T
A B
1 2 3 4 5 6 7
P (cm H 2 O) 280
40
Increased Volume
Increased P ALV
P ALV P ALV
22 © Cengage Learning 2014
1 2 3 4 5 6 7
Time (sec)
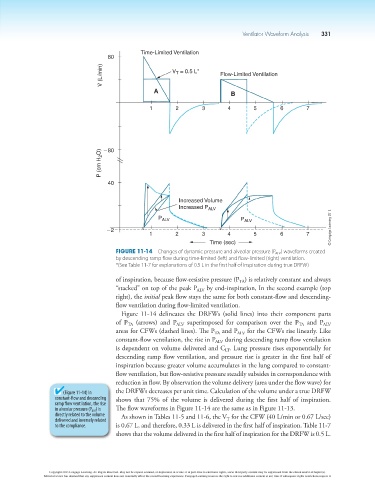
Figure 11-14 Changes of dynamic pressure and alveolar pressure (P ALV ) waveforms created
by descending ramp flow during time-limited (left) and flow-limited (right) ventilation.
*(See Table 11-7 for explanations of 0.5 L in the first half of inspiration during true DRFW)
of inspiration, because flow-resistive pressure (P ) is relatively constant and always
TA
“stacked” on top of the peak P ALV by end-inspiration, In the second example (top
right), the initial peak flow stays the same for both constant-flow and descending-
flow ventilation during flow-limited ventilation.
Figure 11-14 delineates the DRFWs (solid lines) into their component parts
of P (arrows) and P ALV superimposed for comparison over the P and P ALV
TA
TA
areas for CFWs (dashed lines). The P and P ALV for the CFWs rise linearly. Like
TA
constant-flow ventilation, the rise in P ALV during descending ramp flow ventilation
is dependent on volume delivered and C . Lung pressure rises exponentially for
LT
descending ramp flow ventilation, and pressure rise is greater in the first half of
inspiration because greater volume accumulates in the lung compared to constant-
flow ventilation, but flow-resistive pressure steadily subsides in correspondence with
reduction in flow. By observation the volume delivery (area under the flow wave) for
(Figure 11-14) In the DRFWs decreases per unit time. Calculation of the volume under a true DRFW
constant-flow and descending shows that 75% of the volume is delivered during the first half of inspiration.
ramp flow ventilation, the rise
in alveolar pressure (P ALV ) is The flow waveforms in Figure 11-14 are the same as in Figure 11-13.
directly related to the volume As shown in Tables 11-5 and 11-6, the V for the CFW (40 L/min or 0.67 L/sec)
delivered and inversely related T
to the compliance. is 0.67 L, and therefore, 0.33 L is delivered in the first half of inspiration. Table 11-7
shows that the volume delivered in the first half of inspiration for the DRFW is 0.5 L.
Copyright 2013 Cengage Learning. All Rights Reserved. May not be copied, scanned, or duplicated, in whole or in part. Due to electronic rights, some third party content may be suppressed from the eBook and/or eChapter(s).
Editorial review has deemed that any suppressed content does not materially affect the overall learning experience. Cengage Learning reserves the right to remove additional content at any time if subsequent rights restrictions require it.