Page 361 - Clinical Application of Mechanical Ventilation
P. 361

Ventilator Waveform Analysis  327


                                               120

                                              V (L/min)       1     Area 1 = Area 2        2


                                                           1        2        3        4        5        6       7


                                              P (cm H 2 O)


                                                80
                                                                                                   PIP
                                                                       PIP                        P TA  40 cm H O
                                                                      P TA                                   2
                                                                          20 cm H O
                                                                                 2
                                                                   P ALV                       P ALV
                                                           1        2        3        4        5        6       7   © Cengage Learning 2014
                                                                             Time (sec)
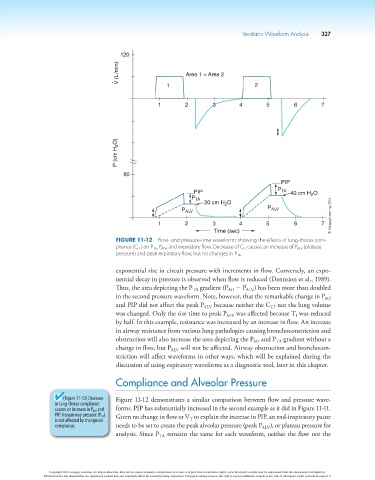
                                             Figure 11-12  Flow- and pressure-time waveforms showing the effects of lung-thorax com-
                                             pliance (C LT ) on P TA , P ALV , and expiratory flow. Decrease of C LT  causes an increase of P ALV  (plateau 
                                             pressure) and peak expiratory flow, but no changes in P TA .

                                             exponential rise in circuit pressure with increments in flow. Conversely, an expo-
                                             nential decay in pressure is observed when flow is reduced (Dennsion et al., 1989).
                                             Thus, the area depicting the P  gradient (P  2 P ALV ) has been more than doubled
                                                                                  AO
                                                                       TA
                                             in the second pressure waveform. Note, however, that the remarkable change in P
                                                                                                                  AO
                                             and PIP did not affect the peak P ALV  because neither the C  nor the lung volume
                                                                                                LT
                                             was changed. Only the rise time to peak P ALV  was affected because T  was reduced
                                                                                                        I
                                             by half. In this example, resistance was increased by an increase in flow. An increase
                                             in airway resistance from various lung pathologies causing bronchoconstriction and
                                             obstruction will also increase the area depicting the P  and P  gradient without a
                                                                                                  TA
                                                                                          AO
                                             change in flow, but P ALV  will not be affected. Airway obstruction and bronchocon-
                                             striction will affect waveforms in other ways, which will be explained during the
                                             discussion of using expiratory waveforms as a diagnostic tool, later in this chapter.

                                             Compliance and Alveolar Pressure


                            (Figure 11-12) Decrease   Figure 11-12 demonstrates a similar comparison between flow and pressure wave-
                          in lung-thorax compliance
                          causes an increase in P ALV  and   forms. PIP has substantially increased in the second example as it did in Figure 11-11.
                          PIP. Transairway pressure (P TA )   Given no change in flow or V  to explain the increase in PIP, an end-inspiratory pause
                          is not affected by changes in               T
                          compliance.        needs to be set to create the peak alveolar pressure (peak P ALV ), or plateau pressure for
                                             analysis. Since P  remains the same for each waveform, neither the flow nor the
                                                            TA


                        Copyright 2013 Cengage Learning. All Rights Reserved. May not be copied, scanned, or duplicated, in whole or in part. Due to electronic rights, some third party content may be suppressed from the eBook and/or eChapter(s).
                      Editorial review has deemed that any suppressed content does not materially affect the overall learning experience. Cengage Learning reserves the right to remove additional content at any time if subsequent rights restrictions require it.
   356   357   358   359   360   361   362   363   364   365   366