
Page 366 - Clinical Application of Mechanical Ventilation
P. 366
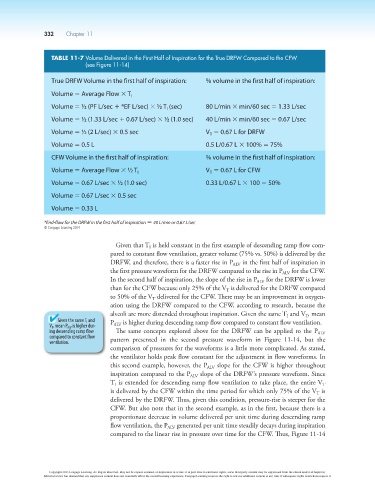
332    Chapter 11


                        TABLE 11-7  Volume Delivered in the First Half of Inspiration for the True DRFW Compared to the CFW
                                    (see Figure 11-14)

                        True DRFW Volume in the first half of inspiration:  % volume in the first half of inspiration:
                        Volume 5 Average Flow 3 T I

                        Volume 5 ½ (PF L/sec 1 *EF L/sec) 3 ½ T  (sec)     80 L/min 3 min/60 sec 5 1.33 L/sec
                                                              I
                        Volume 5 ½ (1.33 L/sec 1 0.67 L/sec) 3 ½ (1.0 sec)  40 L/min 3 min/60 sec 5 0.67 L/sec
                        Volume 5 ½ (2 L/sec) 3 0.5 sec                     V  5 0.67 L for DRFW
                                                                            T
                        Volume 5 0.5 L                                     0.5 L/0.67 L 3 100% 5 75%
                        CFW Volume in the first half of inspiration:       % volume in the first half of inspiration:

                        Volume 5 Average Flow 3 ½ T I                      V  5 0.67 L for CFW
                                                                            T
                        Volume 5 0.67 L/sec 3 ½ (1.0 sec)                  0.33 L/0.67 L 3 100 5 50%
                        Volume 5 0.67 L/sec 3 0.5 sec

                        Volume 5 0.33 L

                      *End-flow for the DRFW in the first half of inspiration 5 40 L/min or 0.67 L/sec
                      © Cengage Learning 2014

                                             Given that T  is held constant in the first example of descending ramp flow com-
                                                        I
                                            pared to constant flow ventilation, greater volume (75% vs. 50%) is delivered by the
                                            DRFW, and therefore, there is a faster rise in P ALV  in the first half of inspiration in
                                            the first pressure waveform for the DRFW compared to the rise in P ALV  for the CFW.
                                            In the second half of inspiration, the slope of the rise in P ALV  for the DRFW is lower
                                            than for the CFW because only 25% of the V  is delivered for the DRFW compared
                                                                                 T
                                            to 50% of the V  delivered for the CFW. There may be an improvement in oxygen-
                                                         T
                                            ation using the DRFW compared to the CFW, according to research, because the
                                            alveoli are more distended throughout inspiration. Given the same T  and V , mean
                                                                                                           T
                                                                                                     I
                          Given the same T I  and   P   is higher during descending ramp flow compared to constant flow ventilation.
                        V T , mean P ALV  is higher dur-  ALV
                        ing descending ramp flow   The same concepts explored above for the DRFW can be applied to the P ALV
                        compared to constant flow   pattern  presented  in  the  second  pressure  waveform  in  Figure  11-14,  but  the
                        ventilation.
                                            comparison of pressures for the waveforms is a little more complicated. As stated,
                                            the ventilator holds peak flow constant for the adjustment in flow waveforms. In
                                            this second example, however, the P ALV  slope for the CFW is higher throughout
                                            inspiration compared to the P ALV  slope of the DRFW’s pressure waveform. Since
                                            T  is extended for descending ramp flow ventilation to take place, the entire V
                                                                                                                 T
                                             I
                                            is delivered by the CFW within the time period for which only 75% of the V  is
                                                                                                               T
                                            delivered by the DRFW. Thus, given this condition, pressure-rise is steeper for the
                                            CFW. But also note that in the second example, as in the first, because there is a
                                            proportionate decrease in volume delivered per unit time during descending ramp
                                            flow ventilation, the P ALV  generated per unit time steadily decays during inspiration
                                            compared to the linear rise in pressure over time for the CFW. Thus, Figure 11-14


                        Copyright 2013 Cengage Learning. All Rights Reserved. May not be copied, scanned, or duplicated, in whole or in part. Due to electronic rights, some third party content may be suppressed from the eBook and/or eChapter(s).
                      Editorial review has deemed that any suppressed content does not materially affect the overall learning experience. Cengage Learning reserves the right to remove additional content at any time if subsequent rights restrictions require it.