
Page 368 - Clinical Application of Mechanical Ventilation
P. 368
334 Chapter 11
100
V (L/min) 50 50% End Flow
5 L/min End Flow
1 2 3 4 5 6 7
P (cm H 2 O) 2100 Increased End Flow
40 Increased End Flow Increased End P TA
Increased End P
TA
P ALV P ALV
22 1 2 3 4 5 6 7 © Cengage Learning 2014
Time (sec)
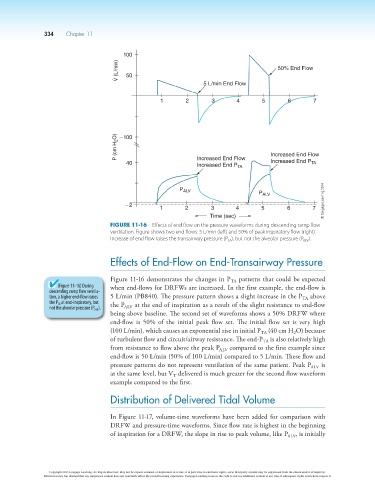
Figure 11-16 Effects of end flow on the pressure waveforms during descending ramp flow
ventilation. Figure shows two end flows: 5 L/min (left) and 50% of peak inspiratory flow (right).
Increase of end flow raises the transairway pressure (P TA ), but not the alveolar pressure (P ALV ).
Effects of End-Flow on End-Transairway Pressure
Figure 11-16 demonstrates the changes in P patterns that could be expected
TA
(Figure 11-16) During when end-flows for DRFWs are increased. In the first example, the end-flow is
descending ramp flow ventila-
tion, a higher end-flow raises 5 L/min (PB840). The pressure pattern shows a slight increase in the P above
TA
the P TA at end-inspiratory, but the P at the end of inspiration as a result of the slight resistance to end-flow
not the alveolar pressure (P ALV ). ALV
being above baseline. The second set of waveforms shows a 50% DRFW where
end-flow is 50% of the initial peak flow set. The initial flow set is very high
(100 L/min), which causes an exponential rise in initial P (40 cm H O) because
2
TA
of turbulent flow and circuit/airway resistance. The end-P is also relatively high
TA
from resistance to flow above the peak P ALV compared to the first example since
end-flow is 50 L/min (50% of 100 L/min) compared to 5 L/min. These flow and
pressure patterns do not represent ventilation of the same patient. Peak P ALV is
at the same level, but V delivered is much greater for the second flow waveform
T
example compared to the first.
Distribution of Delivered Tidal Volume
In Figure 11-17, volume-time waveforms have been added for comparison with
DRFW and pressure-time waveforms. Since flow rate is highest in the beginning
of inspiration for a DRFW, the slope in rise to peak volume, like P ALV , is initially
Copyright 2013 Cengage Learning. All Rights Reserved. May not be copied, scanned, or duplicated, in whole or in part. Due to electronic rights, some third party content may be suppressed from the eBook and/or eChapter(s).
Editorial review has deemed that any suppressed content does not materially affect the overall learning experience. Cengage Learning reserves the right to remove additional content at any time if subsequent rights restrictions require it.