
Page 362 - Clinical Application of Mechanical Ventilation
P. 362
328 Chapter 11
airway resistance has been changed. A decrease in total C is the only explanation for
LT
the increase in PIP, which is supported by the increase in peak P ALV at end-inspiration.
The same peak flow, flow pattern, and volume (Area 1 5 Area 2) are being used for
volume delivery in each example. Total C can be estimated by observing the infor-
LT
mation provided in the graphic comparison and, in this example, it has decreased by
half. The calculated V under the flow curve is 1 L or 1000 mL (1 L/sec 3 1 sec),
T
and total C is 50 mL/cm H O (C 5 1000 mL/20 cm H O) for the first example,
2
LT
LT
2
versus 25 mL/cm H O (1000 mL/40 cm H O) in the second example.
2
2
EFFECTS OF DESCENDING RAMP FLOW WAVEFORM
DURING VOLUME-CONTROLLED VENTILATION
Time- and Flow-Limited Ventilation
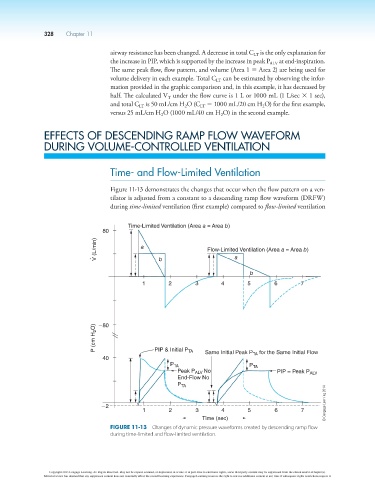
Figure 11-13 demonstrates the changes that occur when the flow pattern on a ven-
tilator is adjusted from a constant to a descending ramp flow waveform (DRFW)
during time-limited ventilation (first example) compared to flow-limited ventilation
Time-Limited Ventilation (Area a = Area b)
80
V (L/min) a b Flow-Limited Ventilation (Area a = Area b)
a
b
1 2 3 4 5 6 7
P (cm H 2 O) 280
TA
40 PIP & Initial P TA Same Initial Peak P for the Same Initial Flow
P TA P TA
Peak P ALV No PIP = Peak P ALV
End-Flow No
P TA
© Cengage Learning 2014
22
1 2 3 4 5 6 7
Time (sec)
Figure 11-13 Changes of dynamic pressure waveforms created by descending ramp flow
during time-limited and flow-limited ventilation.
Copyright 2013 Cengage Learning. All Rights Reserved. May not be copied, scanned, or duplicated, in whole or in part. Due to electronic rights, some third party content may be suppressed from the eBook and/or eChapter(s).
Editorial review has deemed that any suppressed content does not materially affect the overall learning experience. Cengage Learning reserves the right to remove additional content at any time if subsequent rights restrictions require it.