
Page 359 - Clinical Application of Mechanical Ventilation
P. 359
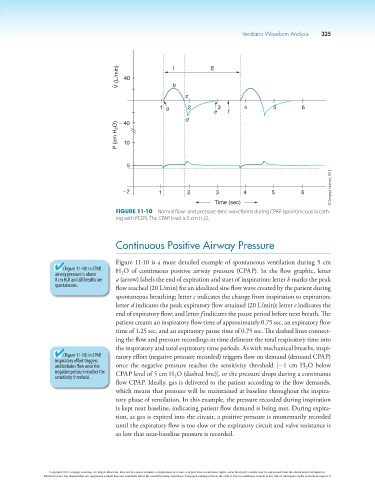
Ventilator Waveform Analysis  325


                                              V (L/min)  40     I b         E


                                                                    c

                                                            1 a      2         3       4         5        6
                                                                              e   f
                                                                    d
                                              240
                                              P (cm H 2 O)  10


                                                 5
                                                                                                                    © Cengage Learning 2014

                                               22          1         2        3        4        5         6

                                                                              Time (sec)
                                             Figure 11-10  Normal flow- and pressure-time waveforms during CPAP (spontaneous breath-
                                             ing with PEEP). The CPAP level is 5 cm H 2 O.


                                             Continuous Positive Airway Pressure


                                             Figure 11-10 is a more detailed example of spontaneous ventilation during 5 cm
                            (Figure 11-10) In CPAP,   H O of continuous positive airway pressure (CPAP). In the flow graphic, letter
                          airway pressure is above   2
                          0 cm H 2 O and all breaths are   a (arrow) labels the end of expiration and start of inspiration; letter b marks the peak
                          spontaneous.       flow reached (20 L/min) for an idealized sine flow wave created by the patient during
                                             spontaneous breathing; letter c indicates the change from inspiration to expiration;
                                             letter d indicates the peak expiratory flow attained (20 L/min); letter e indicates the
                                             end of expiratory flow; and letter f indicates the pause period before next breath. The
                                             patient creates an inspiratory flow time of approximately 0.75 sec, an expiratory flow
                                             time of 1.25 sec, and an expiratory pause time of 0.75 sec. The dashed lines connect-
                                             ing the flow and pressure recordings in time delineate the total respiratory time into
                                             the inspiratory and total expiratory time periods. As with mechanical breaths, inspi-
                            (Figure 11-10) In CPAP,   ratory effort (negative pressure recorded) triggers flow on demand (demand CPAP)
                          inspiratory effort triggers
                          and initiates flow once the   once the negative pressure reaches the sensitivity threshold [21 cm H O below
                                                                                                           2
                          negative pressure reaches the   CPAP level of 5 cm H O (dashed line)], or the pressure drops during a continuous
                          sensitivity threshold.                 2
                                             flow CPAP. Ideally, gas is delivered to the patient according to the flow demands,
                                             which means that pressure will be maintained at baseline throughout the inspira-
                                             tory phase of ventilation. In this example, the pressure recorded during inspiration
                                             is kept near baseline, indicating patient flow demand is being met. During expira-
                                             tion, as gas is expired into the circuit, a positive pressure is momentarily recorded
                                             until the expiratory flow is too slow or the expiratory circuit and valve resistance is
                                             so low that near-baseline pressure is recorded.


                        Copyright 2013 Cengage Learning. All Rights Reserved. May not be copied, scanned, or duplicated, in whole or in part. Due to electronic rights, some third party content may be suppressed from the eBook and/or eChapter(s).
                      Editorial review has deemed that any suppressed content does not materially affect the overall learning experience. Cengage Learning reserves the right to remove additional content at any time if subsequent rights restrictions require it.