
Page 302 - Cardiac Nursing
P. 302
0:4
0:4
1
1
1 A
M
M
1 A
M
009
3
3
xd
3
0/0
6/2
009
0/0
6/2
p
p
A
p
t
ara
ara
t
ara
A
g
g
Pa
Pa
g
78
78
e 2
e 2
K34
13_
K34
0-c
13_
LWB
LWB
0-c
LWBK340-c13_ p p pp277-290.qxd 30/06/2009 10:41 AM Page 278 Aptara
27
q
90.
q
xd
q
7-2
27
7-2
90.
278 P A R T III / Assessment of Heart Disease
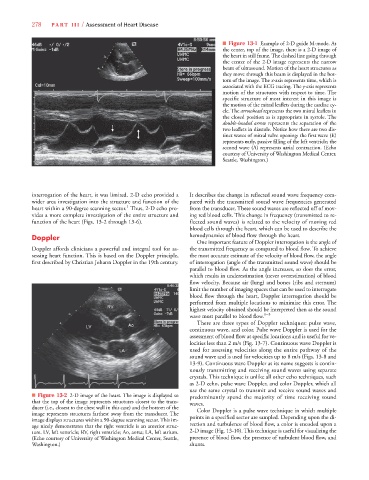
■ Figure 13-1 Example of 2-D guide M-mode. At
the center, top of the image, there is a 2-D image of
the heart in still frame. The dashed line going through
the center of the 2-D image represents the narrow
beam of ultrasound. Motion of the heart structures as
they move through this beam is displayed in the bot-
tom of the image. The x-axis represents time, which isx x
associated with the ECG tracing. The y-axis represents
motion of the structures with respect to time. The
specific structure of most interest in this image is
the motion of the mitral leaflets during the cardiac cy-
cle. The arrowhead represents the two mitral leaflets in
the closed position as is appropriate in systole. The
double-headed arrow represents the separation of the
two leaflets in diastole. Notice how there are two dis-
tinct waves of mitral valve opening: the first wave (E)
represents early, passive filling of the left ventricle; the
second wave (A) represents atrial contraction. (Echo
courtesy of University of Washington Medical Center,
Seattle, Washington.)
interrogation of the heart, it was limited. 2-D echo provided a It describes the change in reflected sound wave frequency com-
wider area investigation into the structure and function of the pared with the transmitted sound wave frequencies generated
1
heart within a 90-degree scanning sector. Thus, 2-D echo pro- from the transducer. These sound waves are reflected off of mov-
vides a more complete investigation of the entire structure and ing red blood cells. This change in frequency (transmitted to re-
function of the heart (Figs. 13-2 through 13-6). flected sound waves) is related to the velocity of moving red
blood cells through the heart, which can be used to describe the
Doppler hemodynamics of blood flow through the heart.
One important feature of Doppler interrogation is the angle of
Doppler affords clinicians a powerful and integral tool for as- the transmitted frequency as compared to blood flow. To achieve
sessing heart function. This is based on the Doppler principle, the most accurate estimate of the velocity of blood flow, the angle
first described by Christian Johann Doppler in the 19th century. of interrogation (angle of the transmitted sound wave) should be
parallel to blood flow. As the angle increases, so does the error,
which results in underestimation (never overestimation) of blood
flow velocity. Because air (lung) and bones (ribs and sternum)
limit the number of imaging spaces that can be used to interrogate
blood flow through the heart, Doppler interrogation should be
performed from multiple locations to minimize this error. The
highest velocity obtained should be interpreted then as the sound
wave most parallel to blood flow. 1–3
There are three types of Doppler techniques: pulse wave,
continuous wave, and color. Pulse wave Doppler is used for the
assessment of blood flow at specific locations and is useful for ve-
locities less than 2 m/s (Fig. 13-7). Continuous wave Doppler is
used for assessing velocities along the entire pathway of the
sound wave and is used for velocities up to 8 m/s (Figs. 13-8 and
13-9). Continuous wave Doppler as its name suggests is contin-
uously transmitting and receiving sound waves using separate
crystals. This technique is unlike all other echo techniques, such
as 2-D echo, pulse wave Doppler, and color Doppler, which all
use the same crystal to transmit and receive sound waves and
■ Figure 13-2 2-D image of the heart. The image is displayed so predominantly spend the majority of time receiving sound
that the top of the image represents structures closest to the trans- waves.
ducer (i.e., closest to the chest wall in this case) and the bottom of the Color Doppler is a pulse wave technique in which multiple
image represents structures farthest away from the transducer. The
image displays structures within a 90-degree scanning sector. This im- points in a specified sector are sampled. Depending upon the di-
age nicely demonstrates that the right ventricle is an anterior struc- rection and turbulence of blood flow, a color is encoded upon a
ture. LV, left ventricle; RV, right ventricle; Ao, aorta; LA, left atrium. 2-D image (Fig. 13-10). This technique is useful for visualizing the
(Echo courtesy of University of Washington Medical Center, Seattle, presence of blood flow, the presence of turbulent blood flow, and
Washington.) shunts.