
Page 305 - Cardiac Nursing
P. 305
1
1
009
6/2
009
2 A
M
2 A
0:4
0:4
xd
3
xd
q
q
0/0
6/2
0/0
3
3
M
p
p
p
A
A
ara
ara
ara
t
t
g
g
Pa
M
Pa
81
81
e 2
g
e 2
q
K34
K34
LWBK340-c13_ pp277-290.qxd 30/06/2009 10:42 AM Page 281 Aptara
0-c
13_
13_
0-c
p
27
7-2
27
p
7-2
90.
90.
C HAPTER 1 3 / Echocardiography 281
■ Figure 13-6 Echolucent (black) spaces within the pericardial space (left and middle) represent pericardiale e
effusions. Echolucent spaces (right) outside of the pericardium but within the pleural space represent a right-
t
t
sided pleural effusion. LV, left ventricle; PE, pericardial effusion; PL, pleural effusion. (Echo courtesy of Uni-
versity of Washington Medical Center, Seattle, Washington.)
■ Figure 13-7 With pulse wave Doppler, a 2-D
image (top) is used to localize the specific area (dashed
arrow) of the heart in which velocity is measured.
x
x
Time (cardiac cycle) is displayed on the x-axis and ve-
locities on the y-axis (m/s). Systole and diastole can be
distinguished based on the ECG signal. The arrow
represents the peak velocity seen in the left ventricu-
lar outflow tract in this patient. (Echo courtesy of
University of Washington Medical Center, Seattle,
Washington.)
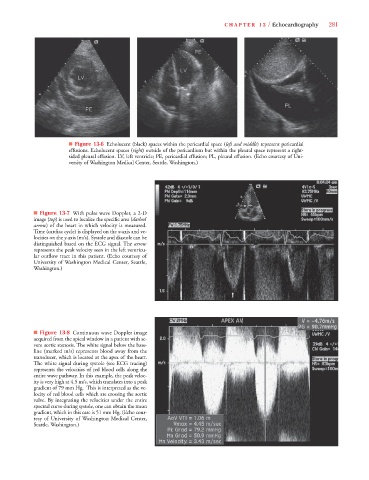
■ Figure 13-8 Continuous wave Doppler image
acquired from the apical window in a patient with se-
vere aortic stenosis. The white signal below the base-
line (marked m/s) represents blood away from the
transducer, which is located at the apex of the heart.
The white signal during systole (see ECG tracing)
represents the velocities of red blood cells along the
entire wave pathway. In this example, the peak veloc-
ity is very high at 4.5 m/s, which translates into a peak
gradient of 79 mm Hg. This is interpreted as the ve-
locity of red blood cells which are crossing the aortic
valve. By integrating the velocities under the entire
spectral curve during systole, one can obtain the mean
gradient, which in this case is 51 mm Hg. (Echo cour-
tesy of University of Washington Medical Center,
Seattle, Washington.)