
Page 331 - Cardiac Nursing
P. 331
xd
xd
q
q
/29
/29
6
6
e 3
0-3
07
07
32.
q
0-3
32.
0 P
0 P
0:3
g
M
Pa
Pa
M
e 3
g
/09
/09
g
0:3
1
1
30
LWBK340-c15_
In
In
a
a
c.
15_
LWB
c.
K34
0-c
A
p
A
30
LWB K34 0-c 15_ p p pp300-332.qxd 6/29/09 10:30 PM Page 307 Aptara Inc.
p
t
ara
ara
p
t
C HAPTER 1 5 / Electrocardiography 307
wave as the septum depolarizes from left to right away from the
90 positive electrode, and a large R wave as electrical activity spreads
120 60 toward the positive electrode through the thick left ventricle. Nor-
AVR AVL mal R-wave progression means that the R wave gets progressively
150 30
V V
larger from V 1 to V 6 , or that V 6 is predominantly an R wave com-
V V
pared with V 1 , which is predominantly an S wave. Often the
180 0 I
largest precordial R wave is recorded in lead V 4 or V 5 .
V
1 1 1 1 1 1 1 1 1 1 1 1 1 1 1 1 1 1 1 1 1 1 1 1 1 1 1 1 1 1 1 1 1 1 1 1 1 1 1 1 1 1 1 Many variations of the above patterns exist among individuals
150
30 and represent normal variants in the ECG. Leads III and aVR
2
may record larger Q waves because of their rightward orientation
120
60 6,7
III
90 II (Fig. 15-11A) , lead III may record a large S wave if the heart sits
AVF horizontally in the chest, and lead aVL may record a large S wave
8
if the heart sits more vertically in the chest. Variations in P-wave
and T-wave morphology can also be normal variants depending
on how the heart physically sits in the chest.
A
The Normal Adult 12-Lead ECG
Figure 15-12 shows a normal 12-lead ECG. Normal sinus rhythm is
present at a rate of 70 beats per minute, and the axis is approximately
60 degrees. P waves are normal (they are flat in aVL, but this find-
2 2 ing is a normal variant), and T waves are normal (flat or slightly in-
V 6
1 verted in lead aVL and V 1 is a normal variant). The QRS complex
is normal (0.08 second wide), there are no abnormal Q waves, and
R-wave progression is normal across the precordium. The ST seg-
ment is at baseline in all leads. This ECG can be used for compari-
V
5
son as abnormalities are discussed throughout this chapter.
V
4
V 1 V 2 V 3
AXIS DETERMINATION
Conduction of a wave of depolarization through the myocardium
B
results in propagation of thousands of electrical potentials in mul-
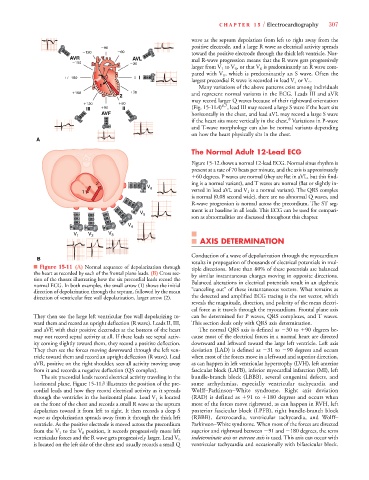
■ Figure 15-11 (A) Normal sequence of depolarization through tiple directions. More than 80% of these potentials are balanced
the heart as recorded by each of the frontal plane leads. (B) Cross sec- by similar instantaneous charges moving in opposite directions.
tion of the thorax illustrating how the six precordial leads record the
normal ECG. In both examples, the small arrow (1) shows the initial Balanced alterations in electrical potentials result in an algebraic
direction of depolarization through the septum, followed by the mean “canceling out” of these instantaneous vectors. What remains as
direction of ventricular free wall depolarization, larger arrow (2). the detected and amplified ECG tracing is the net vector, which
reveals the magnitude, direction, and polarity of the mean electri-
cal force as it travels through the myocardium. Frontal plane axis
They then see the large left ventricular free wall depolarizing to- can be determined for P waves, QRS complexes, and T waves.
ward them and record an upright deflection (R wave). Leads II, III, This section deals only with QRS axis determination.
and aVF, with their positive electrodes at the bottom of the heart The normal QRS axis is defined as 30 to
90 degrees be-
may not record septal activity at all. If these leads see septal activ- cause most of the electrical forces in a normal heart are directed
ity coming slightly toward them, they record a positive deflection. downward and leftward toward the large left ventricle. Left axis
They then see the forces moving downward through the left ven- deviation (LAD) is defined as 31 to 90 degrees and occurs
tricle toward them and record an upright deflection (R wave). Lead when most of the forces move in a leftward and superior direction,
aVR, positive on the right shoulder, sees all activity moving away as can happen in left ventricular hypertrophy (LVH), left anterior
from it and records a negative deflection (QS complex). fascicular block (LAFB), inferior myocardial infarction (MI), left
The six precordial leads record electrical activity traveling in the bundle-branch block (LBBB), several congenital defects, and
horizontal plane. Figure 15-11B illustrates the position of the pre- some arrhythmias, especially ventricular tachycardia and
cordial leads and how they record electrical activity as it spreads Wolff–Parkinson–White syndrome. Right axis deviation
through the ventricles in the horizontal plane. Lead V 1 is located (RAD) is defined as
91 to
180 degrees and occurs when
on the front of the chest and records a small R wave as the septum most of the forces move rightward, as can happen in RVH, left
depolarizes toward it from left to right. It then records a deep S posterior fascicular block (LPFB), right bundle-branch block
wave as depolarization spreads away from it through the thick left (RBBB), dextrocardia, ventricular tachycardia, and Wolff–
ventricle. As the positive electrode is moved across the precordium Parkinson–White syndrome. When most of the forces are directed
V V
from the V 1 to the V 6 position, it records progressively more left superior and rightward between 91 and 180 degrees, the term
V indeterminate axis or extreme axis is used. This axis can occur with
ventricular forces and the R wave gets progressively larger. Lead V 6
is located on the left side of the chest and usually records a small Q ventricular tachycardia and occasionally with bifascicular block.