
Page 505 - Cardiac Nursing
P. 505
LWBK340-c21_p460-510.qxd 09/09/2009 08:28 AM Page 481 Aptara
C HAP TE R 2 1 / Hemodynamic Monitoring 481
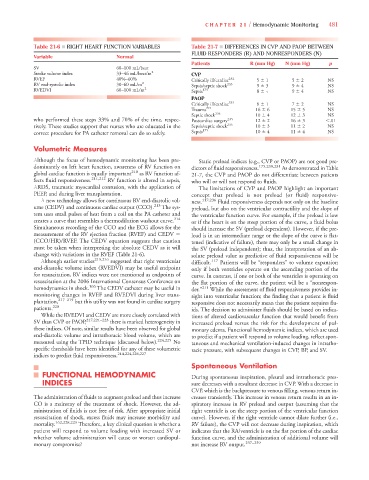
Table 21-6 ■ RIGHT HEART FUNCTION VARIABLES Table 21-7 ■ DIFFERENCES IN CVP AND PAOP BETWEEN
FLUID RESPONDERS (R) AND NONRESPONDERS (N)
Variable Normal
Patients R (mm Hg) N (mm Hg) p
SV 60–100 mL/beat
Stroke volume index 33–46 mL/beat/m 2 CVP
RVEF 40%–60% Critically ill/cardiac 232 5 1 5 2 NS
RV end-systolic index 30–60 mL/m 2 Sepsis/septic shock 233 9 3 9 4 NS
RVEDVI 60–100 mL/m 2 Sepsis 175 8 4 9 4 NS
PAOP
Critically ill/cardiac 232 8 1 7 2 NS
Trauma 221 16 6 15 5 NS
Septic shock 234 10 4 12 3 NS
who performed these steps 33% and 70% of the time, respec- Postcardiac surgeryy 235 12 2 16 3 .01
tively. These studies support that nurses who are educated in the Sepsis/septic shock 233 10 3 11 2 NS
correct procedure for PA catheter removal can do so safely. Sepsis 175 10 4 11 4 NS
Volumetric Measures
Although the focus of hemodynamic monitoring has been pre- Static preload indices (e.g., CVP or PAOP) are not good pre-
dominantly on left heart function, awareness of RV function on dictors of fluid responsiveness. 175,230,231 As demonstrated in Table
global cardiac function is equally important 210 as RV function af- 21-7, the CVP and PAOP do not differentiate between patients
fects fluid responsiveness. 211,212 RV function is altered in sepsis, who will or will not respond to fluids.
ARDS, traumatic myocardial contusion, with the application of The limitations of CVP and PAOP highlight an important
PEEP, and during liver transplantation. concept that preload is not preload (or fluid) responsive-
A new technology allows for continuous RV end-diastolic vol- ness. 117,236 Fluid responsiveness depends not only on the baseline
ume (CEDV) and continuous cardiac output (CCO). 213 The sys- preload, but also on the ventricular contractility and the slope of
tem uses small pulses of heat from a coil on the PA catheter and the ventricular function curve. For example, if the preload is low
creates a curve that resembles a thermodilution washout curve. 214 or if the heart is on the steep portion of the curve, a fluid bolus
Simultaneous recording of the CCO and the ECG allows for the should increase the SV (preload dependent). However, if the pre-
measurement of the RV ejection fraction (RVEF) and CEDV load is in an intermediate range or the slope of the curve is flat-
(CCO/HR)/RVEF. The CEDV equation suggests that caution tened (indicative of failure), there may only be a small change in
must be taken when interpreting the absolute CEDV as it will the SV (preload independent); thus, the interpretation of an ab-
change with variations in the RVEF (Table 21-6). solute preload value as predictive of fluid responsiveness will be
Although earlier studies 215,216 suggested that right ventricular difficult. 117 Patients will be “responders” to volume expansion
end-diastolic volume index (RVEDVI) may be useful endpoint only if both ventricles operate on the ascending portion of the
for resuscitation, RV indices were not mentioned as endpoints of curve. In contrast, if one or both of the ventricles is operating on
resuscitation at the 2006 International Consensus Conference on the flat portion of the curve, the patient will be a “nonrespon-
hemodynamics in shock. 166 The CEDV catheter may be useful in der.” 211 While the assessment of fluid responsiveness provides in-
monitoring changes in RVEF and RVEDVI during liver trans- sight into ventricular function; the finding that a patient is fluid
plantation, 217–219 but this utility was not found in cardiac surgery responsive does not necessarily mean that the patient requires flu-
patients. 220 ids. The decision to administer fluids should be based on indica-
While the RVEDVI and CEDV are more closely correlated with tions of altered cardiovascular function that would benefit from
SV than CVP or PAOP , 217,221–223 there is marked heterogeneity in increased preload versus the risk for the development of pul-
these indices. Of note, similar results have been observed for global monary edema. Functional hemodynamic indices, which are used
end-diastolic volume and intrathoracic blood volume, which are to predict if a patient will respond to volume loading, reflect spon-
measured using the TPID technique (discussed below). 224,225 No taneous and mechanical ventilation-induced changes in intratho-
specific thresholds have been identified for any of these volumetric racic pressure, with subsequent changes in CVP, BP, and SV.
indices to predict fluid responsiveness. 214,224,226,227
Spontaneous Ventilation
FUNCTIONAL HEMODYNAMIC During spontaneous inspiration, pleural and intrathoracic pres-
INDICES sure decreases with a resultant decrease in CVP. With a decrease in
CVP, which is the backpressure to venous filling, venous return in-
The administration of fluids to augment preload and thus increase creases transiently. This increase in venous return results in an in-
CO is a mainstay of the treatment of shock. However, the ad- spiratory increase in RV preload and output (assuming that the
ministration of fluids is not free of risk. After appropriate initial right ventricle is on the steep portion of the ventricular function
resuscitation of shock, excess fluids may increase morbidity and curve). However, if the right ventricle cannot dilate further (i.e.,
mortality. 162,228,229 Therefore, a key clinical question is whether a RV failure), the CVP will not decrease during inspiration, which
patient will respond to volume loading with increased SV or indicates that the RA/ventricle is on the flat portion of the cardiac
whether volume administration will cause or worsen cardiopul- function curve, and the administration of additional volume will
monary compromise? not increase RV output. 237–239