Page 501 - Cardiac Nursing
P. 501

10.
                           qxd
                                               P
                         10.
                                                    77
                                                  e 4
                                                 g
                                               P
                                  9/2
                                        8:2
                                    009
                                9/0
                                             M
                                           8 A
                               0
         L L LWB
         LWB K34 0-c 21_ p46 0-5 10. qxd  0 9/0 9/2 009  0 0 8:2 8 A M  P a a g e 4 77  Apt ara
         LWBK340-c21_21_p460-510.qxd  09/09/2009  08:28 AM  Page 477 Aptara
                 21_
            K34
            K34
               0-c
                                                       Apt
                                                         ara
                    p46
                       0-5
                                                    77
                                                                           C HAPTER 2 1 / Hemodynamic Monitoring   477


                                                 60

                                                                                                         0.30
                              0.32                                                                           “V”
                                  “V”
                             PAS                 40


                                                                                                     WEDGE
                             PAEDP
                                                 20


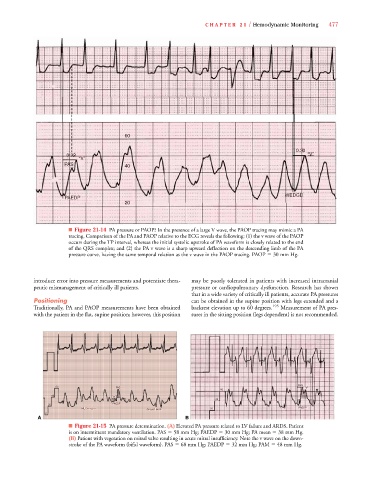
                              ■ Figure 21-14 PA pressure or PAOP? In the presence of a large V wave, the PAOP tracing may mimic a PA
                              tracing. Comparison of the PA and PAOP relative to the ECG reveals the following: (1) the v wave of the PAOP
                              occurs during the TP interval, whereas the initial systolic upstroke of PA waveform is closely related to the end
                              of the QRS complex; and (2) the PA v wave is a sharp upward deflection on the descending limb of the PA
                              pressure curve, having the same temporal relation as the v wave in the PAOP tracing. PAOP   30 mm Hg.


                   introduce error into pressure measurements and potentiate thera-  may be poorly tolerated in patients with increased intracranial
                   peutic mismanagement of critically ill patients.    pressure or cardiopulmonary dysfunction. Research has shown
                                                                       that in a wide variety of critically ill patients, accurate PA pressures
                   Positioning                                         can be obtained in the supine position with legs extended and a
                   Traditionally, PA and PAOP measurements have been obtained  backrest elevation up to 60 degrees. 195  Measurement of PA pres-
                   with the patient in the flat, supine position; however, this position  sures in the sitting position (legs dependent) is not recommended.


                                                                                                         PAS
                          60                  PAS                                                           “V”
                                                                                60
                         40                  “a”
                                                                              40
                        20                   PAEDP
                                   MECH VENT            SPONT INSP           20                           PAEDP
                       0
                    A                                                B
                              ■ Figure 21-15 PA pressure determination. (A) Elevated PA pressure related to LV failure and ARDS. Patient
                              is on intermittent mandatory ventilation. PAS   58 mm Hg; PAEDP   30 mm Hg; PA mean   38 mm Hg.
                              (B) Patient with vegetation on mitral valve resulting in acute mitral insufficiency. Note the v wave on the down-
                              stroke of the PA waveform (bifid waveform). PAS   68 mm Hg; PAEDP   32 mm Hg; PAM   48 mm Hg.
   496   497   498   499   500   501   502   503   504   505   506