
Page 716 - Cardiac Nursing
P. 716
P
/1/
09
g
49
p65
04.
qxd
AM
7
5-7
0-c
tar
Ap
692
K34
L L LWB
LWB K34 0-c 28_ p65 5-7 04. qxd 7 /1/ 09 9: 49 AM P a a g e e 692 Ap tar a a
LWBK340-c28_p655-704.qxd 7/1/09 9:9:49 AM Page 692 Aptara
28_
25 mm/s
Spontanaous Atri al E GM
a
E
Atrial EGM
M
Atrial
A A
EGM
Type
Time 05:25 1775 ms V V entricular r r E G M s s
tricular
tricular EGM
V V V Ve
entricular EGMs
n
Ventricular EGMs
r
EGM
l
l
EGMs
GM
EGM
EGM
t
ric
t
t
i
ula
ricular EGM
i
04-OCT-2007 From top trace to bottom trace, traces are:
Date Onset EGM (10 sec max) AS AS AS AS AS AS AS 30 AG AS AS AS AS AS AS AS AS AS AS AS
105
3
133
0
113
193 050
145
173
125 93
93
113
325
100 113 198
118 225
120
G
A
S
A
G
S
A
S]
[A
AG [AS]
265
228
188
253
280 140
220 103
08
140
203
318 88
12
143
Episode 18 Caliper Time Difference Trace Order Atrial Vent Shock VS AS AG VT AG AG [AS] AS AS ASSASA 145 105120 AS S VS ASS AS AS S S VS AS A AS VT AS AS AS AS [AS] AS
VS
VS
VT
320
540
205
503
370
505
300
VS
340
350
620
385
370 VS VS VS VT VT VS
330
305
a
25 mm/s
Atrial EGMM
t
r
Atrial EGM
ta
A
ria
G
r
G
E
EG
r
Ms
ularr
ular
Ms
u
M Ms
Ve
EGM
Ve e e ntr i c u ar r r EG M
Ve
ntricu
E EG
ntric
Pre-attempt EGM (10 sec max) [A [A S AS AS AG AS AS AS ASS AS S [AS] ASS AS S S AS S A
AS AG [AS] AS AS [AS] AG AS AS AS AS AS AS Initial Detection VF Zone Pre-attempt Avg A Rate 250 bpm Pre-attempt Avg V Rate 247 bpm AS AS AS [AS] [AS] AS [AS] [AS] AS AS AS AS AS AS
185
93
88
130 138 93 88 285 118 108 210 288 125 105 100 190 100 185 108 93 315 105 108 118
A
[AS]S]
AS AS AS AS AS AS AS AS AS AS AS AS AS
0 103 235 215 175 105 235 110 215 110 213 93 140 85 213 148 250 268 290 223 373 188 205 248 265 1
VS VT VS VF VF VF VF VF VF VF VF VF VF VF
233
240
230
240
235
240
235
238
398 303 600 233 238 225 VF VF VF VF VF VF VF VF VF
VS VS VT VT VT VF 238 248 248 245 248 245 250 245 255
533 358 298 323 300 223 Detct
Epad Chrg
b
25 mm/s
Atrial EGMEGMM
G
At rial EGM
Atrial
M
ntr
n
rE
ula
u
ulaar
Ve
Ve e entric c c c c c c c c c c c c ula a a ar r E G Ms
Ve
Ve
e
entric
entric
e
e
r
M Ms
Ms
G
Ms
G
G
G
E
r
r EG
rEGG
AS [AS] [AS] AS AS AS AS AS AS Attempt Type 31J, Biphasic Therapy Delivered VF Shock 1 Pre-attempt EGM (10 sec max) Pre-attempt Avg A Rate bpm Pre-attempt Avg V Rate 115 bpm (AS) AS AS AS
I 145 235 178 213 155 175 163 520 545 498 503
5 AS AS AS AS AS AS AS AS Elapsed Time 00:02 AS AS AS AS
0 113 190 238 128 153 86 375 135 003 490 500 623
F VF VF VF VF VF VF Attempt t VS VS VP-MT VP
3
50 250 250 240 253 160 253 438 455 500 590
3
VF VF VF VF VF VF VS VS VP-MT VP-MT VP
253 255 258 240 90 253 535 443 500 500 500
Chrg Shock PVP+
c
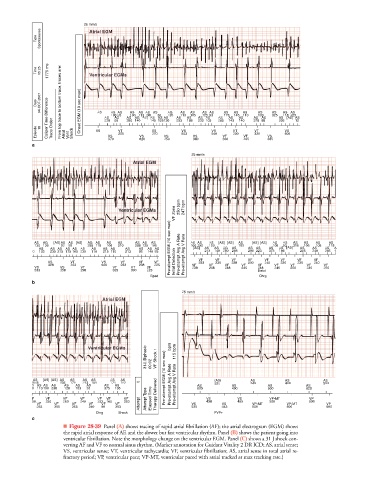
■ Figure 28-39 Panel (A) shows tracing of rapid atrial fibrillation (AF); the atrial electrogram (EGM) shows
the rapid atrial response of AF, and the slower but fast ventricular rhythm. Panel (B) shows the patient going into
ventricular fibrillation. Note the morphology change on the ventricular EGM. Panel (C) shows a 31 J shock con-
verting AF and VF to normal sinus rhythm. (Marker annotation for Guidant Vitality 2 DR ICD; AS, atrial sense;
VS, ventricular sense; VT, ventricular tachycardia; VF, ventricular fibrillation; AS, atrial sense in total atrial re-
fractory period; VP, ventricular pace; VP-MT, ventricular paced with atrial tracked at max tracking rate.)