
Page 207 - ACCCN's Critical Care Nursing
P. 207
184 P R I N C I P L E S A N D P R A C T I C E O F C R I T I C A L C A R E
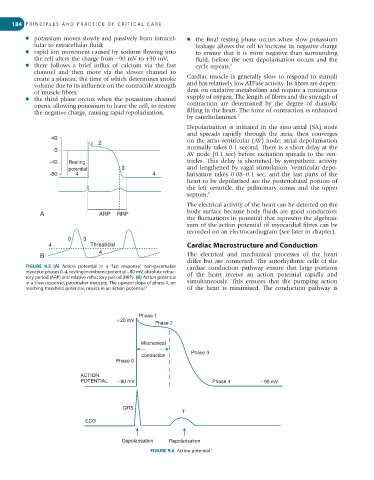
● potassium moves slowly and passively from intracel- ● the final resting phase occurs when slow potassium
lular to extracellular fluid; leakage allows the cell to increase its negative charge
● rapid ion movement caused by sodium flowing into to ensure that it is more negative than surrounding
the cell alters the charge from −90 mV to +30 mV; fluid, before the next depolarisation occurs and the
● there follows a brief influx of calcium via the fast cycle repeats. 6
channel and then more via the slower channel to
create a plateau, the time of which determines stroke Cardiac muscle is generally slow to respond to stimuli
volume due to its influence on the contractile strength and has relatively low ATPase activity. Its fibres are depen-
of muscle fibres; dent on oxidative metabolism and require a continuous
● the third phase occurs when the potassium channel supply of oxygen. The length of fibres and the strength of
opens, allowing potassium to leave the cell, to restore contraction are determined by the degree of diastolic
the negative charge, causing rapid repolarisation. filling in the heart. The force of contraction is enhanced
by catecholamines. 2
Depolarisation is initiated in the sino-atrial (SA) node
and spreads rapidly through the atria, then converges
40 on the atrio-ventricular (AV) node; atrial depolarisation
2
0 normally takes 0.1 second. There is a short delay at the
AV node (0.1 sec) before excitation spreads to the ven-
-40 Resting tricles. This delay is shortened by sympathetic activity
potential 3 and lengthened by vagal stimulation. Ventricular depo-
-80 4 4 larisation takes 0.08–0.1 sec, and the last parts of the
heart to be depolarised are the posteriobasal portion of
the left ventricle, the pulmonary conus and the upper
septum. 8
The electrical activity of the heart can be detected on the
A ARP RRP body surface because body fluids are good conductors;
the fluctuations in potential that represent the algebraic
sum of the action potential of myocardial fibres can be
recorded on an electrocardiogram (see later in chapter).
0 3
4 Threshold Cardiac Macrostructure and Conduction
4
B The electrical and mechanical processes of the heart
differ but are connected. The autorhythmic cells of the
FIGURE 9.5 (A) Action potential in a ‘fast response’, non-pacemaker cardiac conduction pathway ensure that large portions
myocyte: phases 0–4, resting membrane potential −80 mV, absolute refrac- of the heart receive an action potential rapidly and
tory period (ARP) and relative refractory period (RRP). (B) Action potential
in a ‘slow response’, pacemaker myocyte. The upward slope of phase 4, on simultaneously. This ensures that the pumping action
reaching threshold potential, results in an action potential. of the heart is maximised. The conduction pathway is
7
Phase 1
20 mV
Phase 2
Mechanical
Phase 3
contraction
Phase 0
ACTION
POTENTIAL 90 mV Phase 4 90 mV
QRS
T
ECG
Depolarisation Repolarisation
FIGURE 9.6 Action potential. 5