
Page 210 - ACCCN's Critical Care Nursing
P. 210
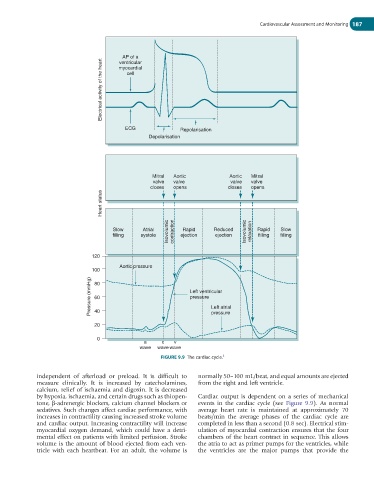
Cardiovascular Assessment and Monitoring  187


                                         AP of a
                                  Electrical activity of the heart  cell
                                        ventricular
                                        myocardial


                                          ECG               Repolarisation
                                                  Depolarisation


                                                   Mitral  Aortic           Aortic  Mitral
                                                   valve  valve             valve  valve
                                                  closes  opens             closes  opens
                                  Heart status


                                                        Isovolumic  contraction  Isovolumic  relaxation
                                      Slow      Atrial       Rapid     Reduced       Rapid   Slow
                                      filling  systole      ejection   ejection      filling  filling


                               120
                                        Aortic pressure
                               100
                               Pressure (mmHg)  80             Left ventricular


                                                               pressure
                                60
                                                                      Left atrial
                                40

                                20                                    pressure
                                 0
                                                a     c   v
                                               wave  wave wave
                                                      FIGURE 9.9  The cardiac cycle.   5


             independent  of  afterload  or  preload.  It  is  difficult  to   normally 50–100 mL/beat, and equal amounts are ejected
             measure  clinically.  It  is  increased  by  catecholamines,   from the right and left ventricle.
             calcium, relief of ischaemia and digoxin. It is decreased
             by hypoxia, ischaemia, and certain drugs such as thiopen-  Cardiac output is dependent on a series of mechanical
             tone, β-adrenergic blockers, calcium channel blockers or   events  in  the  cardiac  cycle  (see  Figure  9.9).  As  normal
             sedatives. Such changes affect cardiac performance, with   average  heart  rate  is  maintained  at  approximately  70
             increases in contractility causing increased stroke volume   beats/min  the  average  phases  of  the  cardiac  cycle  are
             and cardiac output. Increasing contractility will increase   completed in less than a second (0.8 sec). Electrical stim-
             myocardial  oxygen  demand,  which  could  have  a  detri-  ulation of myocardial contraction ensures that the four
             mental effect on patients with limited perfusion. Stroke   chambers of the heart contract in sequence. This allows
             volume is the amount of blood ejected from each ven-  the atria to act as primer pumps for the ventricles, while
             tricle  with  each  heartbeat.  For  an  adult,  the  volume  is   the  ventricles  are  the  major  pumps  that  provide  the