
Page 216 - ACCCN's Critical Care Nursing
P. 216
Cardiovascular Assessment and Monitoring 193
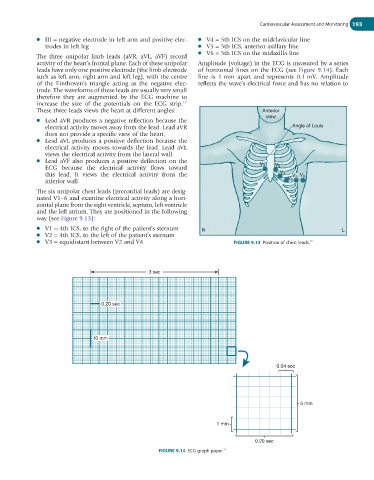
● III = negative electrode in left arm and positive elec- ● V4 = 5th ICS on the midclavicular line
trodes in left leg ● V5 = 5th ICS, anterior axillary line
● V6 = 5th ICS on the midaxilla line
The three unipolar limb leads (aVR, aVL, aVF) record
activity of the heart’s frontal plane. Each of these unipolar Amplitude (voltage) in the ECG is measured by a series
leads have only one positive electrode (the limb electrode of horizontal lines on the ECG (see Figure 9.14). Each
such as left arm, right arm and left leg), with the centre line is 1 mm apart and represents 0.1 mV. Amplitude
of the Einthoven’s triangle acting as the negative elec- reflects the wave’s electrical force and has no relation to
trode. The waveforms of these leads are usually very small
therefore they are augmented by the ECG machine to
increase the size of the potentials on the ECG strip.
17
These three leads views the heart at different angles: Anterior
view
● Lead aVR produces a negative reflection because the
electrical activity moves away from the lead. Lead aVR Angle of Louis
does not provide a specific view of the heart.
● Lead aVL produces a positive deflection because the
electrical activity moves towards the lead. Lead aVL
views the electrical activity from the lateral wall.
● Lead aVF also produces a positive deflection on the
ECG because the electrical activity flows toward V 1 V 2
this lead. It views the electrical activity from the V 3 V 5 V 6
inferior wall. V 4
The six unipolar chest leads (precordial leads) are desig-
nated V1–6 and examine electrical activity along a hori-
zontal plane from the right ventricle, septum, left ventricle
and the left atrium. They are positioned in the following
way (see Figure 9.13):
● V1 = 4th ICS, to the right of the patient’s sternum R L
● V2 = 4th ICS, to the left of the patient’s sternum
● V3 = equidistant between V2 and V4 FIGURE 9.13 Position of chest leads.
17
3 sec
0.20 sec
10 mm
0.04 sec
5 mm
1 mm
0.20 sec
17
FIGURE 9.14 ECG graph paper.