
Page 217 - ACCCN's Critical Care Nursing
P. 217
194 P R I N C I P L E S A N D P R A C T I C E O F C R I T I C A L C A R E
8
the muscle strength of ventricular contraction. Duration plus >25% of R wave height) may indicate a previous
of activity within the ECG is measured by a series of verti- myocardial infarction, however, not every myocardial
18
cal lines also 1 mm apart (see Figure 9.14). The time infarction will result in a pathological Q wave and
interval between each line is 0.04 sec. Every 5th line is some abnormal Q waves, in combination of other
printed in bold, producing large squares. Each represents ECG changes and patient symtoms, may indicate a
19
0.5 mV (vertically) and 0.2 sec (horizontally). current myocardial infarction. Pathological Q waves
could also be seen in non-ischaemic conditions such
Key Components of the ECG as Wolff–Parkinson–White syndrome (WPW). 20
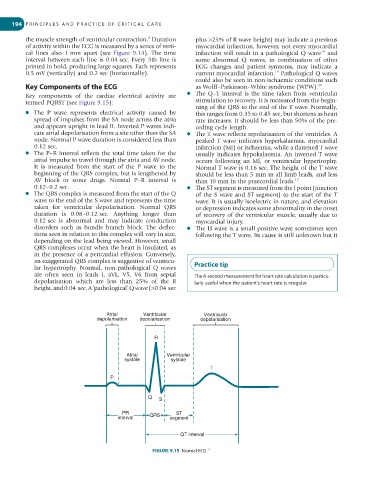
Key components of the cardiac electrical activity are ● The Q–T interval is the time taken from ventricular
termed PQRST (see Figure 9.15): stimulation to recovery. It is measured from the begin-
ning of the QRS to the end of the T wave. Normally,
● The P wave represents electrical activity caused by this ranges from 0.35 to 0.45 sec, but shortens as heart
spread of impulses from the SA node across the atria rate increases. It should be less than 50% of the pre-
and appears upright in lead II. Inverted P waves indi- ceding cycle length.
cate atrial depolarisation from a site other than the SA ● The T wave reflects repolarisation of the ventricles. A
node. Normal P wave duration is considered less than peaked T wave indicates hyperkalaemia, myocardial
0.12 sec. infarction (MI) or ischaemia, while a flattened T wave
● The P–R interval reflects the total time taken for the usually indicates hypokalaemia. An inverted T wave
atrial impulse to travel through the atria and AV node. occurs following an MI, or ventricular hypertrophy.
It is measured from the start of the P wave to the Normal T wave is 0.16 sec. The height of the T wave
beginning of the QRS complex, but is lengthened by should be less than 5 mm in all limb leads, and less
AV block or some drugs. Normal P–R interval is than 10 mm in the praecordial leads. 17
0.12–0.2 sec. ● The ST segment is measured from the J point (junction
● The QRS complex is measured from the start of the Q of the S wave and ST segment) to the start of the T
wave to the end of the S wave and represents the time wave. It is usually isoelectric in nature, and elevation
taken for ventricular depolarisation. Normal QRS or depression indicates some abnormality in the onset
duration is 0.08–0.12 sec. Anything longer than of recovery of the ventricular muscle, usually due to
0.12 sec is abnormal and may indicate conduction myocardial injury.
disorders such as bundle branch block. The deflec- ● The U wave is a small positive wave sometimes seen
tions seen in relation to this complex will vary in size, following the T wave. Its cause is still unknown but it
depending on the lead being viewed. However, small
QRS complexes occur when the heart is insulated, as
in the presence of a pericardial effusion. Conversely,
an exaggerated QRS complex is suggestive of ventricu-
lar hypertrophy. Normal, non-pathological Q waves Practice tip
are often seen in leads I, aVL, V5, V6 from septal The 6-second measurement for heart rate calculation is particu-
depolarisation which are less than 25% of the R larly useful when the patient’s heart rate is irregular.
height, and 0.04 sec. A ‘pathological’ Q wave (>0.04 sec
Atrial Ventricular Ventricular
depolarisation depolarisation depolarisation
R
Atrial Ventricular
systole systole
T
P
Q S
PR ST
interval QRS segment
QT interval
FIGURE 9.15 Normal ECG.
17