
Page 227 - ACCCN's Critical Care Nursing
P. 227
204 P R I N C I P L E S A N D P R A C T I C E O F C R I T I C A L C A R E
circulating blood volumes, particularly when a patient from the end of diastole to the end of the ejection phase
is artificially ventilated. Derived normal value for is measured and combined with an individual calibration
2
intrathoracic blood volume index 850–1000 mL/m . factor. The algorithm is capable of computing each single
● Extravascular lung water (EVLW): the amount of water stroke volume after being calibrated by an initial trans-
content in the lungs; allows quantification of the pulmonary thermodilution.
degree of pulmonary oedema (not evident with X-ray PiCCO preload indicators of intrathoracic blood volume
or blood gases). Derived normal value for extravascu- (ITBV) and global end-diastolic volume (GEDV) are more
lar lung water index is 3–7 mL/kg. EVLW has been sensitive and specific to cardiac preload than the standard
shown to be useful as a guide for fluid management cardiac filling pressures of CVP and PCWP, as well as right
67
in critically ill patients. An elevated EVLW may be an ventricular end-diastolic volume. One advantage of
40
effective indicator of severity of illness, particularly ITBV and GEDV is that they are not affected by mechani-
after acute lung injury or in ARDS, when EVLW is cal ventilation and therefore give correct information on
72
elevated due to alterations in hydrostatic pressures. the preload status under almost any condition. Extravas-
Other patients at risk of high EVLW are those with left cular lung water correlates moderately well with severity
heart failure, severe pneumonia, and burns. There may of ARDS, length of ventilation days, ICU stay and mortal-
be an association between a high EVLW and increased ity, and appears to be of greater accuracy than the
74
mortality, the need for mechanical ventilation and a traditional assessment of lung oedema by chest X-ray.
72
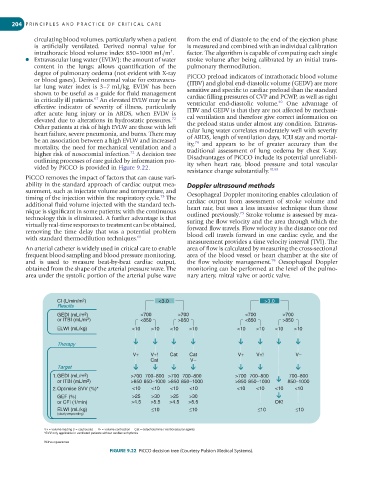
higher risk of nosocomial infection. A decision tree Disadvantages of PiCCO include its potential unreliabil-
outlining processes of care guided by information pro- ity when heart rate, blood pressure and total vascular
vided by PiCCO is provided in Figure 9.22.
resistance change substantially. 10,68
PiCCO removes the impact of factors that can cause vari-
ability in the standard approach of cardiac output mea- Doppler ultrasound methods
surement, such as injectate volume and temperature, and
73
timing of the injection within the respiratory cycle. The Oesophageal Doppler monitoring enables calculation of
additional fluid volume injected with the standard tech- cardiac output from assessment of stroke volume and
nique is significant in some patients; with the continuous heart rate, but uses a less invasive technique than those
75
technology this is eliminated. A further advantage is that outlined previously. Stroke volume is assessed by mea-
virtually real-time responses to treatment can be obtained, suring the flow velocity and the area through which the
removing the time delay that was a potential problem forward flow travels. Flow velocity is the distance one red
with standard thermodilution techniques. 61 blood cell travels forward in one cardiac cycle, and the
measurement provides a time velocity interval (TVI). The
An arterial catheter is widely used in critical care to enable area of flow is calculated by measuring the cross-sectional
frequent blood sampling and blood pressure monitoring, area of the blood vessel or heart chamber at the site of
76
and is used to measure beat-by-beat cardiac output, the flow velocity management. Oesophageal Doppler
obtained from the shape of the arterial pressure wave. The monitoring can be performed at the level of the pulmo-
area under the systolic portion of the arterial pulse wave nary artery, mitral valve or aortic valve.
2
CI (L/min/m ) <3.0 >3.0
Results
GEDI (mL/m 2 ) <700 >700 <700 >700
2
or ITBI (mL/m ) <850 >850 <850 >850
ELWI (mL/kg) <10 >10 <10 >10 <10 >10 <10 >10
Therapy
V+ V+! Cat Cat V+ V+! V–
Cat V–
Target
1.GEDI (mL/m 2 ) >700 700–800 >700 700–800 >700 700–800 700–800
or ITBI (mL/m ) >850 850–1000 >850 850–1000 >850 850–1000 850–1000
2
2.Optimise SVV (%)* <10 <10 <10 <10 <10 <10 <10 <10
GEF (%) >25 >30 >25 >30
or CFI (1/min) >4.5 >5.5 >4.5 >5.5 OK!
ELWI (mL/kg) ≤10 ≤10 ≤10 ≤10
(slowly responding)
V+ = volume loading (! = cautiously) V- = volume contraction Cat = catecholamine / cardiovascular agents
*SVV only applicable in ventilated patients without cardiac arrhythmia
Without guarantee
FIGURE 9.22 PiCCO decision tree (Courtesy Pulsion Medical Systems).