
Page 896 - Hematology_ Basic Principles and Practice ( PDFDrive )
P. 896
Chapter 56 Conventional and Molecular Cytogenomic Basis of Hematologic Malignancies 779
A B C
D E F
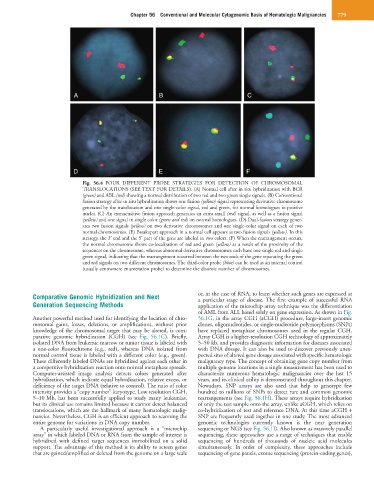
Fig. 56.4 FOUR DIFFERENT PROBE STRATEGIES FOR DETECTION OF CHROMOSOMAL
TRANSLOCATIONS (SEE TEXT FOR DETAILS). (A) Normal cell after in situ hybridization with BCR
(green) and ABL (red) showing a normal distribution of two red and two green single signals. (B) Conventional
fusion strategy after in situ hybridization shows one fusion (yellow) signal representing derivative chromosome
generated by the translocation and one single-color signal, red and green, for normal homologues in positive
nuclei. (C) An extrasensitive fusion approach generates an extra small (red) signal, as well as a fusion signal
(yellow) and one signal in single color (green and red) on normal homologues. (D) Dual-fusion strategy gener-
ates two fusion signals (yellow) on two derivative chromosomes and one single-color signal on each of two
normal chromosomes. (E) Breakapart approach in a normal cell appears as two fusion signals (yellow). In this
strategy, the 3′ end and the 5′ part of the gene are labeled in two colors. (F) When the rearrangement occurs,
the normal chromosome shows co-localization of red and green (yellow) as a result of the proximity of the
sequences on the chromosome, whereas abnormal derivative chromosomes each have one single red and single
green signal, indicating that the rearrangement occurred between the two ends of the gene separating the green
and red signals on two different chromosomes. The third-color probe (blue) can be used as an internal control
(usually centromere enumeration probe) to determine the disomic number of chromosomes.
Comparative Genomic Hybridization and Next or, in the case of RNA, to learn whether such genes are expressed at
a particular stage of disease. The first example of successful RNA
Generation Sequencing Methods application of the microchip array technique was the differentiation
of AML from ALL based solely on gene expression. As shown in Fig.
Another powerful method used for identifying the location of chro- 56.1G, in the array CGH (aCGH) procedure, large-insert genomic
mosomal gains, losses, deletions, or amplifications, without prior clones, oligonucleotides, or single-nucleotide polymorphisms (SNPs)
knowledge of the chromosomal target that may be altered, is com- have replaced metaphase chromosomes used in the regular CGH.
parative genomic hybridization (CGH) (see Fig. 56.1C). Briefly, Array CGH is a higher-resolution CGH technology of approximately
isolated DNA from leukemic marrow or tumor tissue is labeled with 5–50 kb, and provides diagnostic information for diseases associated
a one-color fluorochrome (e.g., red), whereas DNA isolated from with DNA dosage. It can also be used to discover previously unex-
normal control tissue is labeled with a different color (e.g., green). pected sites of altered gene dosage associated with specific hematologic
These differently labeled DNAs are hybridized against each other in malignancy type. The concept of obtaining gene copy number from
a competitive hybridization reaction onto normal metaphase spreads. multiple genome locations in a single measurement has been used to
Computer-assisted image analysis detects colors generated after characterize numerous hematologic malignancies over the last 15
hybridization, which indicate equal hybridization, relative excess, or years, and its clinical utility is demonstrated throughout this chapter.
deficiency of the target DNA (relative to control). The ratio of color Nowadays, SNP arrays are also used that help to genotype few
intensity provides a “copy number” karyotype. Low resolution CGH, hundred to millions of SNPs to detect rare and common genomic
5–10 Mb, has been successfully applied to study many leukemias, rearrangements (see Fig. 56.1H). These arrays require hybridization
but its clinical use remains limited because it cannot detect balanced of only the test sample onto the array, unlike aCGH, which relies on
translocations, which are the hallmark of many hematologic malig- co-hybridization of test and reference DNA. At this time aCGH +
nancies. Nevertheless, CGH is an efficient approach to scanning the SNP are frequently used together in one study. The most advanced
entire genome for variations in DNA copy number. genomic technologies currently known is the next generation
A particularly useful investigational approach is a “microchip sequencing or NGS (see Fig. 56.1I). Also known as massively parallel
array” in which labeled DNA or RNA from the sample of interest is sequencing, these approaches use a range of techniques that enable
hybridized with defined target sequences immobilized on a solid sequencing of hundreds of thousands of nucleic acid molecules
support. The advantage of this method is its ability to screen genes simultaneously. In order of complexity, these approaches include
that are gained/amplified or deleted from the genome on a large scale sequencing of gene panels, exome sequencing (protein-coding genes),