
Page 933 - Hematology_ Basic Principles and Practice ( PDFDrive )
P. 933
816 Part VII Hematologic Malignancies
MLL–ENL
TLX1 0.3%
0.3%
LYL1 ETP 2%
1.4%
Others (T-ALL)
TLX3
Others (B–ALL) 2.3% 1.7%
4.5% TAL1 MYCt(8;14), t(2;8), t(8,22)
TCF3–HLF 7% 2%
0.5%
ETV6–RUNX1
Hypodiploid 44 20%
1%
MLL–AFF1
2% Other MLL
rearragements 4% Hyperdiploid 50
25%
iAMP21
2%
dic(9;20) TCF3–PBX1
4%
2%
BCR–ABL 1–like
ERG 9%
4%
CRLF2
4%
BCR–ABL 1
2%
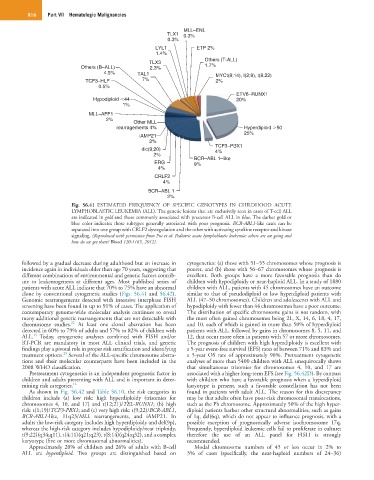
Fig. 56.41 ESTIMATED FREQUENCY OF SPECIFIC GENOTYPES IN CHILDHOOD ACUTE
LYMPHOBLASTIC LEUKEMIA (ALL). The genetic lesions that are exclusively seen in cases of T-cell ALL
are indicated in gold and those commonly associated with precursor B-cell ALL in blue. The darker gold or
blue color indicates those subtypes generally associated with poor prognosis. BCR-ABL1-like cases can be
separated into one group with CRLF2 dysregulation and the other with activating cytokine receptor and kinase
signaling. (Reproduced with permission from Pui et al: Pediatric acute lymphoblastic leukemia: where are we going and
how do we get there? Blood 120:1165, 2012).
followed by a gradual decrease during adulthood but an increase in cytogenetics: (a) those with 51–55 chromosomes whose prognosis is
incidence again in individuals older than age 70 years, suggesting that poorer, and (b) those with 56–67 chromosomes whose prognosis is
different combinations of environmental and genetic factors contrib- excellent. Both groups have a more favorable prognosis than do
ute to leukemogenesis at different ages. Most published series of children with hypodiploidy or near-haploid ALL. In a study of 1880
patients with acute ALL indicate that 70% to 75% have an abnormal children with ALL, patients with 45 chromosomes have an outcome
clone by conventional cytogenetic studies (Figs. 56.41 and 56.42). similar to that of pseudodiploid or low hyperdiploid patients with
Genomic rearrangements detected with intensive interphase FISH ALL (47–50 chromosomes). Children and adolescents with ALL and
screening have been found in up to 91% of cases. The application of hypodiploidy with fewer than 44 chromosomes have a poor outcome.
contemporary genome-wide molecular analysis continues to reveal The distribution of specific chromosome gains is not random, with
many additional genetic rearrangements that are not detectable with the most often gained chromosomes being 21, X, 14, 6, 18, 4, 17,
22
chromosome studies. At least one clonal aberration has been and 10, each of which is gained in more than 50% of hyperdiploid
detected in 60% to 79% of adults and 57% to 82% of children with patients with ALL, followed by gains in chromosomes 8, 5, 11, and
15
ALL. Today, cytogenetic analyses combined with FISH and/or 12, that occur more often in patients with 57 or more chromosomes.
RT-PCR are mandatory in most ALL clinical trials, and genetic The prognosis of children with high hyperdiploidy is excellent with
findings play a pivotal role in proper risk stratification and identifying a 5-year event-free survival (EFS) rates of between 71% and 83% and
23
treatment options. Several of the ALL-specific chromosome aberra- a 5-year OS rate of approximately 90%. Pretreatment cytogenetic
tions and their molecular counterparts have been included in the analyses of more than 5400 children with ALL unequivocally shows
2008 WHO classification. that simultaneous trisomies for chromosomes 4, 10, and 17 are
Pretreatment cytogenetics is an independent prognostic factor in associated with a higher long-term EFS (see Fig. 56.42D). By contrast
children and adults presenting with ALL and is important in deter- with children who have a favorable prognosis when a hyperdiploid
mining risk categories. 16 karyotype is present, such a favorable constellation has not been
As shown in Fig. 56.42 and Table 56.10, the risk categories in found in patients with adult ALL. The reason for this discrepancy
children include (a) low risk: high hyperdiploidy (trisomies for may be that adults often have poor-risk chromosomal translocations,
chromosomes 4, 10, and 17) and t(12;21)/TEL-RUNX1; (b) high such as the Ph chromosome. Approximately 50% of the high hyper-
risk: t(1;19)/TCF3-PBX1; and (c) very high risk: t(9;22)/BCR-ABL1, diploid patients harbor other structural abnormalities, such as gains
BCR-ABL1-like, 11q23/MLL rearrangements, and iAMP21. In of 1q, del(6q), which do not appear to influence prognosis, with a
adults the low-risk category includes high hyperdiploidy and del(9p), possible exception of prognostically adverse isochromosome 17q.
whereas the high-risk category includes hypodiploidy/near triploidy, Frequently, hyperdiploid leukemic cells fail to proliferate in culture;
t(9;22)(q34;q11), t(4;11)(q21;q23), t(8;14)(q24;q32), and a complex therefore the use of an ALL panel for FISH is strongly
karyotype (five or more chromosomal abnormalities). recommended.
Approximately 20% of children and 26% of adults with B-cell Modal chromosome numbers of 45 or less occur in 2% to
ALL are hyperdiploid. Two groups are distinguished based on 3% of cases (specifically, the near-haploid numbers of 24–36)