
Page 495 - Williams Hematology ( PDFDrive )
P. 495
470 Part VI: The Erythrocyte Chapter 31: Structure and Composition of the Erythrocyte 471
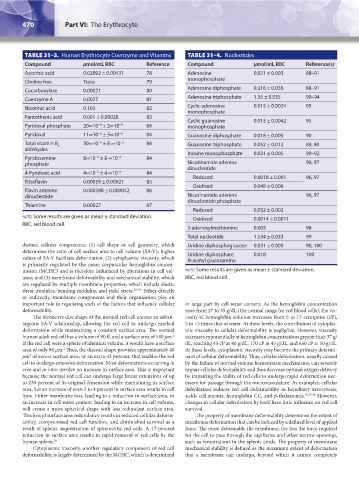
TABLE 31–3. Human Erythrocyte Coenzyme and Vitamins TABLE 31–4. Nucleotides
Compound μmol/mL RBC Reference Compound μmol/mL RBC Reference(s)
Ascorbic acid 0.02892 ± 0.00431 78 Adenosine 0.021 ± 0.003 88–91
Choline free Trace 79 monophosphate
Cocarboxylase 0.00021 80 Adenosine diphosphate 0.216 ± 0.036 88–91
Coenzyme A 0.0027 81 Adenosine triphosphate 1.35 ± 0.035 90–94
Nicotinic acid 0.105 82 Cyclic adenosine 0.015 ± 0.0024 95
monophosphate
Pantothenic acid 0.001 ± 0.00028 83
Cyclic guanosine 0.013 ± 0.0042 95
Pyridoxal phosphate 20∞10 ± 2∞10 −6 84 monophosphate
−6
−6
Pyridoxal 11∞10 ± 3∞10 −6 84 Guanosine diphosphate 0.018 ± 0.005 90
Total vitamin B 30∞10 ± 8 ∞10 −6 84 Guanosine triphosphate 0.052 ± 0.012 89, 90
−6
6
aldehydes
Inosine monophosphate 0.031 ± 0.005 90–92
Pyridoxamine 8∞10 ± 8 ∞10 −6 84
−6
phosphate Nicotinamide adenine 96, 97
dinucleotide
4-Pyridoxic acid 4∞10 ± 4 ∞10 −6 84
−6
Reduced 0.0018 ± 0.001 96, 97
Riboflavin 0.00059 ± 0.00021 85
Oxidized 0.049 ± 0.006
Flavin adenine 0.000398 ± 0.000042 86
dinucleotide Nicotinamide adenine 96, 97
dinucleotide phosphate
Thiamine 0.00027 87
Reduced 0.032 ± 0.002
note: Some results are given as mean ± standard deviation. Oxidized 0.0014 ± 0.0011
RBC, red blood cell.
S-adenosylmethionine 0.005 98
Total nucleotide 1.534 ± 0.033 99
distinct cellular components: (1) cell shape or cell geometry, which Uridine diphosphoglucose 0.031 ± 0.005 90, 100
determines the ratio of cell surface area to cell volume (SA:V); higher
values of SA:V facilitate deformation; (2) cytoplasmic viscosity, which Uridine diphosphate 0.018 100
N-acetyl glucosamine
is primarily regulated by the mean corpuscular hemoglobin concen-
tration (MCHC) and is therefore influenced by alterations in cell vol- note: Some results are given as mean ± standard deviation.
ume; and (3) membrane deformability and mechanical stability, which RBC, red blood cell.
are regulated by multiple membrane properties, which include elastic
shear modulus, bending modulus, and yield stress. 52–55 Either directly
or indirectly, membrane components and their organization play an
important role in regulating each of the factors that influence cellular in large part by cell water content. As the hemoglobin concentration
deformability. rises from 27 to 35 g/dL (the normal range for red blood cells), the vis-
The biconcave disc shape of the normal red cell creates an advan- cosity of hemoglobin solution increases from 5 to 15 centipoise (cP),
tageous SA:V relationship, allowing the red cell to undergo marked 5 to 15 times that of water. At these levels, the contribution of cytoplas-
deformation while maintaining a constant surface area. The normal mic viscosity to cellular deformability is negligible. However, viscosity
human adult red cell has a volume of 90 fL and a surface area of 140 μm. increases exponentially at hemoglobin concentrations greater than 37 g/
2
If the red cell were a sphere of identical volume, it would have a surface dL, reaching 45 cP at 40 g/dL, 170 cP at 45 g/dL, and 650 cP at 50 g/dL.
area of only 98 μm. Thus, the discoid shape provides approximately 40 At these levels, cytoplasmic viscosity may become the primary determi-
2
μm of excess surface area, or an extra 43 percent, that enables the red nant of cellular deformability. Thus, cellular dehydration, usually caused
2
cell to undergo extensive deformation. Most deformations occurring in by the failure of normal volume homeostasis mechanisms, can severely
vivo and in vitro involve no increase in surface area. This is important impair cellular deformability and thus decrease optimal oxygen delivery
because the normal red cell can undergo large linear extensions of up by impairing the ability of red cells to undergo rapid deformation nec-
to 230 percent of its original dimension while maintaining its surface essary for passage through the microvasculature. As examples, cellular
area, but an increase of even 3 to 4 percent in surface area results in cell dehydration reduces red cell deformability in hereditary xerocytosis,
lysis. Either membrane loss, leading to a reduction in surface area, or sickle cell anemia, hemoglobin CC, and β-thalassemia. 55,57,58 However,
an increase in cell water content, leading to an increase in cell volume, changes in cellular dehydration by itself have little influence on red cell
will create a more spherical shape with less redundant surface area. survival.
This loss of surface area redundancy results in reduced cellular deform- The property of membrane deformability determines the extent of
ability, compromised red cell function, and diminished survival as a membrane deformation that can be induced by a defined level of applied
result of splenic sequestration of spherocytic red cells. A 17-percent force. The more deformable the membrane, the less the force required
reduction in surface area results in rapid removal of red cells by the for the cell to pass through the capillaries and other narrow openings,
human spleen. 56 such as fenestrations in the splenic cords. The property of membrane
Cytoplasmic viscosity, another regulatory component of red cell mechanical stability is defined as the maximum extent of deformation
deformability, is largely determined by the MCHC, which is determined that a membrane can undergo, beyond which it cannot completely
Kaushansky_chapter 31_p0459-0478.indd 470 9/18/15 10:59 PM