
Page 496 - Williams Hematology ( PDFDrive )
P. 496
470 Part VI: The Erythrocyte Chapter 31: Structure and Composition of the Erythrocyte 471
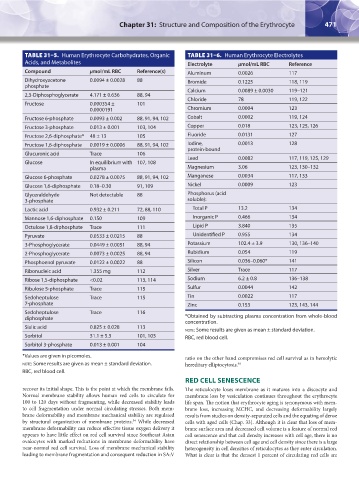
TABLE 31–5. Human Erythrocyte Carbohydrates, Organic TABLE 31–6. Human Erythrocyte Electrolytes
Acids, and Metabolites Electrolyte μmol/mL RBC Reference
Compound μmol/mL RBC Reference(s) Aluminum 0.0026 117
Dihydroxyacetone 0.0094 ± 0.0028 88 Bromide 0.1225 118, 119
phosphate
Calcium 0.0089 ± 0.0030 119–121
2,3-Diphosphoglycerate 4.171 ± 0.636 88, 94
Chloride 78 119, 122
Fructose 0.000354 ± 101
0.0000191 Chromium 0.0004 123
Fructose 6-phosphate 0.0093 ± 0.002 88, 91, 94, 102 Cobalt 0.0002 119, 124
Fructose 3-phosphate 0.013 ± 0.001 103, 104 Copper 0.018 123, 125, 126
Fructose 2,6-diphosphate* 48 ± 13 105 Fluoride 0.0131 127
Fructose 1,6-diphosphate 0.0019 ± 0.0006 88, 91, 94, 102 Iodine, 0.0013 128
protein-bound
Glucuronic acid Trace 106
Lead 0.0082 117, 119, 125, 129
Glucose In equilibrium with 107, 108
plasma Magnesium 3.06 123, 130–132
Glucose 6-phosphate 0.0278 ± 0.0075 88, 91, 94, 102 Manganese 0.0034 117, 133
Glucose 1,6-diphosphate 0.18–0.30 91, 109 Nickel 0.0009 123
Glyceraldehyde Not detectable 88 Phosphorus (acid
3-phosphate soluble):
Lactic acid 0.932 ± 0.211 72, 88, 110 Total P 13.2 134
Mannose 1,6-diphosphate 0.150 109 Inorganic P 0.466 134
Octulose 1,8-diphosphate Trace 111 Lipid P 3.840 135
Pyruvate 0.0533 ± 0.0215 88 Unidentified P 0.955 134
3-Phosphoglycerate 0.0449 ± 0.0051 88, 94 Potassium 102.4 ± 3.9 130, 136–140
2-Phosphoglycerate 0.0073 ± 0.0025 88, 94 Rubidium 0.054 119
Phosphoenol pyruvate 0.0122 ± 0.0022 88 Silicon 0.036–0.060* 141
Ribonucleic acid 1.355 mg 112 Silver Trace 117
Ribose 1,5-diphosphate <0.02 113, 114 Sodium 6.2 ± 0.8 136–138
Ribulose 5-phosphate Trace 115 Sulfur 0.0044 142
Sedoheptulose Trace 115 Tin 0.0022 117
7-phosphate Zinc 0.153 123, 143, 144
Sedoheptulose Trace 116
diphosphate *Obtained by subtracting plasma concentration from whole-blood
concentration.
Sialic acid 0.825 ± 0.028 113
note: Some results are given as mean ± standard deviation.
Sorbitol 31.1 ± 5.3 101, 103 RBC, red blood cell.
Sorbitol 3-phosphate 0.013 ± 0.001 104
*Values are given in picomoles. ratio on the other hand compromises red cell survival as in hemolytic
note: Some results are given as mean ± standard deviation. hereditary elliptocytosis. 49
RBC, red blood cell.
RED CELL SENESCENCE
recover its initial shape. This is the point at which the membrane fails. The reticulocyte loses membrane as it matures into a discocyte and
Normal membrane stability allows human red cells to circulate for membrane loss by vesiculation continues throughout the erythrocyte
100 to 120 days without fragmenting, while decreased stability leads life span. The notion that erythrocyte aging is synonymous with mem-
to cell fragmentation under normal circulating stresses. Both mem- brane loss, increasing MCHC, and decreasing deformability largely
brane deformability and membrane mechanical stability are regulated results from studies on density-separated cells and the equating of dense
54
by structural organization of membrane proteins. While decreased cells with aged cells (Chap. 33). Although it is clear that loss of mem-
membrane deformability can reduce effective tissue oxygen delivery it brane surface area and decreased cell volume is a feature of normal red
appears to have little effect on red cell survival since Southeast Asian cell senescence and that cell density increases with cell age, there is no
ovalocytes with marked reductions in membrane deformability have direct relationship between cell age and cell density since there is a large
near-normal red cell survival. Loss of membrane mechanical stability heterogeneity in cell densities of reticulocytes as they enter circulation.
leading to membrane fragmentation and consequent reduction in SA:V What is clear is that the densest 1 percent of circulating red cells are
Kaushansky_chapter 31_p0459-0478.indd 471 9/18/15 10:59 PM