
Page 688 - Williams Hematology ( PDFDrive )
P. 688
662 Part VI: The Erythrocyte Chapter 46: Erythrocyte Membrane Disorders 663
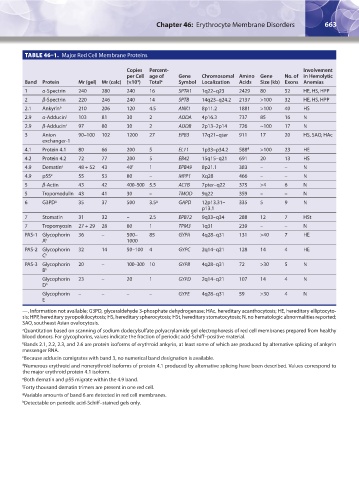
TABLE 46–1. Major Red Cell Membrane Proteins
Copies Percent- Involvement
per Cell age of Gene Chromosomal Amino Gene No. of in Hemolytic
Band Protein Mr (gel) Mr (calc) (×10 ) Total a Symbol Localization Acids Size (kb) Exons Anemias
3
1 α-Spectrin 240 280 240 16 SPTA1 1q22–q23 2429 80 52 HE, HS, HPP
2 β-Spectrin 220 246 240 14 SPTB 14q23–q24.2 2137 >100 32 HE, HS, HPP
2.1 Ankyrin b 210 206 120 4.5 ANK1 8p11.2 1881 >100 40 HS
2.9 α-Adducin c 103 81 30 2 ADDA 4p16.3 737 85 16 N
2.9 β-Adducin c 97 80 30 2 ADDB 2p13–2p14 726 ~100 17 N
3 Anion 90–100 102 1200 27 EPB3 17q21–qter 911 17 20 HS, SAO, HAc
exchanger-1
4.1 Protein 4.1 80 66 200 5 EL11 1p33–p34.2 588 d >100 23 HE
4.2 Protein 4.2 72 77 200 5 EB42 15q15–q21 691 20 13 HS
4.9 Dematin e 48 + 52 43 40 f 1 EPB49 8p21.1 383 – – N
4.9 p55 e 55 53 80 – MPP1 Xq28 466 – – N
5 β-Actin 43 42 400–500 5.5 ACTB 7pter–q22 375 >4 6 N
5 Tropomodulin 43 41 30 – TMOD 9q22 359 – – N
6 G3PD g 35 37 500 3.5 g GAPD 12p13.31– 335 5 9 N
p13.1
7 Stomatin 31 32 – 2.5 EPB72 9q33–q34 288 12 7 HSt
7 Tropomyosin 27 + 29 28 80 1 TPM3 1q31 239 – – N
PAS-1 Glycophorin 36 – 500– 85 GYPA 4q28–q31 131 >40 7 HE
A h 1000
PAS-2 Glycophorin 32 14 50–100 4 GYPC 2q14–q21 128 14 4 HE
C h
PAS-3 Glycophorin 20 – 100–300 10 GYPB 4q28–q31 72 >30 5 N
B h
Glycophorin 23 – 20 1 GYPD 2q14–q21 107 14 4 N
D h
Glycophorin – – – – GYPE 4q28–q31 59 >30 4 N
E
—, Information not available; G3PD, glyceraldehyde 3-phosphate dehydrogenase; HAc, hereditary acanthocytosis; HE, hereditary elliptocyto-
sis; HPP, hereditary pyropoikilocytosis; HS, hereditary spherocytosis; HSt, hereditary stomatocytosis; N, no hematologic abnormalities reported;
SAO, southeast Asian ovalocytosis.
a Quantitation based on scanning of sodium dodecylsulfate polyacrylamide gel electrophoresis of red cell membranes prepared from healthy
blood donors. For glycophorins, values indicate the fraction of periodic acid-Schiff–positive material.
b Bands 2.1, 2.2, 2.3, and 2.6 are protein isoforms of erythroid ankyrin, at least some of which are produced by alternative splicing of ankyrin
messenger RNA.
c Because adducin comigrates with band 3, no numerical band designation is available.
d Numerous erythroid and nonerythroid isoforms of protein 4.1 produced by alternative splicing have been described. Values correspond to
the major erythroid protein 4.1 isoform.
e Both dematin and p55 migrate within the 4.9 band.
f Forty thousand dematin trimers are present in one red cell.
g Variable amounts of band 6 are detected in red cell membranes.
h Detectable on periodic acid-Schiff–stained gels only.
Kaushansky_chapter 46_p0661-0688.indd 663 9/17/15 6:41 PM