
Page 1298 - Hall et al (2015) Principles of Critical Care-McGraw-Hill
P. 1298
CHAPTER 96: Sickle Cell Disease 905
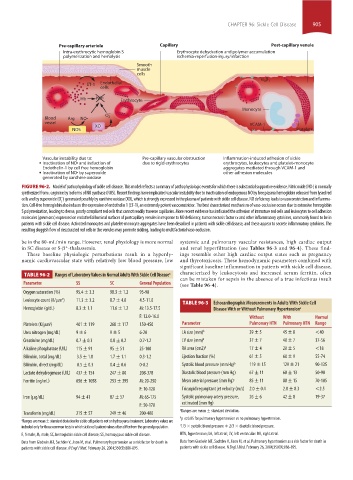
Pre-capillary arteriole Capillary Post-capillary venule
Intra-erythrocytic hemoglobin S Erythrocyte dehydration and polymer accumulation
polymerization and hemolysis ischemia-reperfusion-injury/infarction
Smooth
muscle
cells
4 1
ET-1 Endothelial
cells
Hb NO• Erythrocyte
Monocyte
–
Blood Arg NO• O 2
vessel
XO VCAM-1
NOS Platelets
Vascular instability due to: Pre-capillary vascular obstruction Inflammation-induced adhesion of sickle
Inactivation of NO• and induction of due to rigid erythrocytes erythrocytes, leukocytes and platelet-monocyte
Endothelin-1 by cell free hemoglobin aggregates mediated through VCAM-1 and
Inactivation of NO• by superoxide other adhesion molecules
generated by xanthine oxidase
FIGURE 96-2. Model of pathophysiology of sickle cell disease. This model reflects a summary of pathophysiologic events for which there is substantial supportive evidence. Nitric oxide (NO·) is normally
synthesized from l-arginine by isoforms of NO synthase (NOS). Recent findings have implicated vascular instability due to inactivation of endogenous NO by free plasma hemoglobin released from lysed red
−
cells and by superoxide (O ) generated possibly by xanthine oxidase (XO), which is strongly expressed in the plasma of patients with sickle cell disease. NO deficiency leads to vasoconstriction and inflamma-
2
tion. Cell-free hemoglobin also induces the expression of endothelin 1 (ET-1), an extremely potent vasoconstrictor. The best characterized mechanism of vaso-occlusion occurs due to extensive hemoglobin
S polymerization, leading to dense, poorly compliant red cells that cannot readily traverse capillaries. More recent evidence has indicated the adhesion of immature red cells and leukocytes to cell adhesion
molecules (green arcs) expressed on endothelial luminal surfaces of postcapillary venules in response to NO deficiency, tumor necrosis factor α and other inflammatory cytokines, commonly found to be in
patients with sickle cell disease. Activated monocytes and platelet-monocyte aggregates have been described in patients with sickle cell disease, and these appear to secrete inflammatory cytokines. The
resulting sluggish flow of desaturated red cells in the venules may promote sickling, leading to multifactorial vaso-occlusion.
be in the 80-mL/min range. However, renal physiology is more normal systemic and pulmonary vascular resistances, high cardiac output
in SC disease or S-β -thalassemia. and renal hyperfiltration (see Tables 96-3 and 96-4). These find-
+
These baseline physiologic perturbations result in a hyperdy- ings resemble other high cardiac output states such as pregnancy
namic cardiovascular state with relatively low blood pressure, low and thyrotoxicosis. These hemodynamic parameters combined with
significant baseline inflammation in patients with sickle cell disease,
TABLE 96-2 Ranges of Laboratory Values in Normal Adults With Sickle Cell Disease a characterized by leukocytosis and increased serum ferritin, often
can be mistaken for sepsis in the absence of a true infectious insult
Parameter SS SC General Population (see Table 96-4).
Oxygen saturation (%) 95.4 ± 3.3 98.3 ± 1.2 95-98
Leukocyte count (K/µm ) 3 11.3 ± 3.2 8.7 ± 4.0 4.5-11.0
TABLE 96-3 Echocardiographic Measurements in Adults With Sickle Cell
Hemoglobin (g/dL) 8.3 ± 1.1 11.6 ± 1.2 M: 13.5-17.5 Disease With or Without Pulmonary Hypertension a
F: 12.0-16.0 Without With Normal
Platelets (K/µm ) 3 401 ± 119 268 ± 117 150-450 Parameter Pulmonary HTN Pulmonary HTN Range
Urea nitrogen (mg/dL) 9 ± 6 9 ± 5 6-20 LA size (mm) b 39 ± 5 45 ± 8 <40
Creatinine (mg/dL) 0.7 ± 0.3 0.8 ± 0.2 0.7-1.2 LV size (mm) b 37 ± 7 40 ± 7 37-56
Alkaline phosphatase (U/L) 115 ± 91 95 ± 51 25-100 RA area (cm2) b 17 ± 4 20 ± 5 <18
Bilirubin, total (mg/dL) 3.5 ± 1.8 1.7 ± 1.1 0.3-1.2 Ejection fraction (%) 61 ± 5 60 ± 9 55-74
Bilirubin, direct (mg/dL) 0.5 ± 0.3 0.4 ± 0.6 0-0.2 Systolic blood pressure (mm Hg) b 119 ± 15 129 ± 21 90-135
Lactate dehydrogenase (U/L) 437 ± 154 247 ± 80 208-378 Diastolic blood pressure (mm Hg) 67 ± 11 68 ± 13 50-90
Ferritin (ng/mL) 656 ± 1058 253 ± 395 M: 20-250 Mean arterial pressure (mm Hg) c 85 ± 11 88 ± 15 70-105
F: 10-120 Tricuspid regurgitant jet velocity (m/s) 2.0 ± 0.4 2.8 ± 0.3 <2.5
Iron (µg/dL) 94 ± 41 87 ± 57 M: 65-175 Systolic pulmonary artery pressure, 26 ± 6 42 ± 8 19-37
F: 50-170 estimated (mm Hg)
a Ranges are mean ± standard deviation.
Transferrin (mg/dL) 215 ± 57 249 ± 46 200-400
b p ≤0.05 for pulmonary hypertension vs no pulmonary hypertension.
a Ranges are mean ± standard deviation for sickle cell patients not on hydroxyurea treatment. Laboratory values are
included only for those common tests in which sickle cell patient values often differ from the general population. c 1/3 × systolic blood pressure + 2/3 × diastolic blood pressure.
F, female; M, male; SC, hemoglobin sickle cell disease; SS, homozygous sickle cell disease. HTN, hypertension; LA, left atrial; LV, left ventricular: RA, right atrial.
Data from Gladwin MT, Sachdev V, Jison M, et al. Pulmonary hypertension as a risk factor for death in Data from Gladwin MT, Sachdev V, Jison M, et al. Pulmonary hypertension as a risk factor for death in
patients with sickle cell disease. N Engl J Med. February 26, 2004;350(9):886-895. patients with sickle cell disease. N Engl J Med. February 26, 2004;350(9):886-895.
section07.indd 905 1/21/2015 7:43:20 AM