
Page 381 - 9780077418427.pdf
P. 381
/Users/user-f465/Desktop
tiL12214_ch14_351-376.indd Page 358 9/3/10 6:16 PM user-f465
tiL12214_ch14_351-376.indd Page 358 9/3/10 6:16 PM user-f465 /Users/user-f465/Desktop
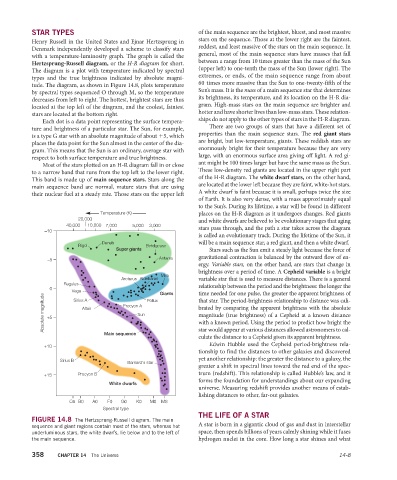
STAR TYPES of the main sequence are the brightest, bluest, and most massive
Henry Russell in the United States and Ejnar Hertzsprung in stars on the sequence. Those at the lower right are the faintest,
Denmark independently developed a scheme to classify stars reddest, and least massive of the stars on the main sequence. In
with a temperature-luminosity graph. The graph is called the general, most of the main sequence stars have masses that fall
Hertzsprung-Russell diagram, or the H-R diagram for short. between a range from 10 times greater than the mass of the Sun
The diagram is a plot with temperature indicated by spectral (upper left) to one-tenth the mass of the Sun (lower right). The
types and the true brightness indicated by absolute magni- extremes, or ends, of the main sequence range from about
tude. The diagram, as shown in Figure 14.8, plots temperature 60 times more massive than the Sun to one-twenty-fifth of the
by spectral types sequenced O through M, so the temperature Sun’s mass. It is the mass of a main sequence star that determines
decreases from left to right. The hottest, brightest stars are thus its brightness, its temperature, and its location on the H-R dia-
located at the top left of the diagram, and the coolest, faintest gram. High-mass stars on the main sequence are brighter and
stars are located at the bottom right. hotter and have shorter lives than low-mass stars. These relation-
Each dot is a data point representing the surface tempera- ships do not apply to the other types of stars in the H-R diagram.
ture and brightness of a particular star. The Sun, for example, There are two groups of stars that have a different set of
is a type G star with an absolute magnitude of about +5, which properties than the main sequence stars. The red giant stars
places the data point for the Sun almost in the center of the dia- are bright, but low-temperature, giants. These reddish stars are
gram. This means that the Sun is an ordinary, average star with enormously bright for their temperature because they are very
respect to both surface temperature and true brightness. large, with an enormous surface area giving off light. A red gi-
Most of the stars plotted on an H-R diagram fall in or close ant might be 100 times larger but have the same mass as the Sun.
to a narrow band that runs from the top left to the lower right. These low-density red giants are located in the upper right part
This band is made up of main sequence stars. Stars along the of the H-R diagram. The white dwarf stars, on the other hand,
main sequence band are normal, mature stars that are using are located at the lower left because they are faint, white-hot stars.
their nuclear fuel at a steady rate. Those stars on the upper left A white dwarf is faint because it is small, perhaps twice the size
of Earth. It is also very dense, with a mass approximately equal
to the Sun’s. During its lifetime, a star will be found in different
Temperature (K) places on the H-R diagram as it undergoes changes. Red giants
20,000 and white dwarfs are believed to be evolutionary stages that aging
40,000 10,000 7,000 5,000 3,000
–10 stars pass through, and the path a star takes across the diagram
is called an evolutionary track. During the lifetime of the Sun, it
Deneb will be a main sequence star, a red giant, and then a white dwarf.
Rigel Betelgeuse
Super giants Stars such as the Sun emit a steady light because the force of
–5 Antares gravitational contraction is balanced by the outward flow of en-
ergy. Variable stars, on the other hand, are stars that change in
brightness over a period of time. A Cepheid variable is a bright
Mira
Arcturus Aldebaran variable star that is used to measure distances. There is a general
Regulus
0 relationship between the period and the brightness: the longer the
Vega Pollux Giants time needed for one pulse, the greater the apparent brightness of
Absolute magnitude +5 Altair Procyon A brated by comparing the apparent brightness with the absolute
Sirius A
that star. The period-brightness relationship to distance was cali-
Sun
magnitude (true brightness) of a Cepheid at a known distance
with a known period. Using the period to predict how bright the
Main sequence star would appear at various distances allowed astronomers to cal-
culate the distance to a Cepheid given its apparent brightness.
+10 Edwin Hubble used the Cepheid period-brightness rela-
tionship to find the distances to other galaxies and discovered
Sirius B Barnard’s star yet another relationship: the greater the distance to a galaxy, the
greater a shift in spectral lines toward the red end of the spec-
+15 Procyon B trum (redshift). This relationship is called Hubble’s law, and it
forms the foundation for understandings about our expanding
White dwarfs
universe. Measuring redshift provides another means of estab-
lishing distances to other, far-out galaxies.
O5 B0 A0 F0 G0 K0 M0 M8
Spectral type
THE LIFE OF A STAR
FIGURE 14.8 The Hertzsprung-Russell diagram. The main
sequence and giant regions contain most of the stars, whereas hot A star is born in a gigantic cloud of gas and dust in interstellar
underluminous stars, the white dwarfs, lie below and to the left of space, then spends billions of years calmly shining while it fuses
the main sequence. hydrogen nuclei in the core. How long a star shines and what
358 CHAPTER 14 The Universe 14-8