
Page 572 - 9780077418427.pdf
P. 572
/Volume/201/MHDQ233/tat78194_disk1of1/0073378194/tat78194_pagefile
tiL12214_ch22_541-564.indd Page 549 9/23/10 11:08 AM user-f465
tiL12214_ch22_541-564.indd Page 549 9/23/10 11:08 AM user-f465 /Volume/201/MHDQ233/tat78194_disk1of1/0073378194/tat78194_pagefiles
2 W _
2 W _
2)
(
2
absorbed energy = 1 m (360 s) 9.8 × 1 0 − 2.5 × 1 0 ing over areas where the air is moving upward. The clear air
2
m
m
between the clouds is over areas where the air is moving down-
2 W _
(
2)
2
= 1 m (360 s) 7.3 × 1 0 ward. On a smaller scale, air can be observed moving from a
m
field of cool grass toward an adjacent asphalt parking lot on a
_ J calm, sunlit day. Soap bubbles or smoke will often reveal the
s _
2
2
= 1(360) (7.3 × 1 0 ) m (s) ( ) gentle air movement of this localized convection.
2
m Depending on local surface conditions, which are in the
5
= 2.6 × 1 0 J section on local wind patterns, the wind usually averages about
16 km/h (about 10 mi/h) and has an average rising and sinking
Step 3 Determine mass of soil.
velocity of about 2 km/h (about 1 mi/h). These normal, average
4
2
A = 1.0 × 1 0 c m m _ values are greatly exceeded during storms and severe weather
ρ = and V = zA ∴ m = ρzA
z = 12 cm V events. A hurricane has winds that exceed 120 km/h (about
g
_
ρ = 1.35 m = ρzA g 75 mi/h), and a thunderstorm can have updrafts and downdrafts
_
3
4
2
c m = 1.35 (12 cm)(1.2 × 10 cm ) between 50 and 100 km/h (about 30 to 60 mi/h). The force
cm 3 exerted by such winds can be very destructive to structures on
m = ?
5
= 1.6 × 10 g the surface. An airplane unfortunate enough to be caught in a
thunderstorm can be severely damaged as it is tossed about by
Step 4 Determine temperature change of soil. The energy can then
the updrafts and downdrafts.
be used with the specific heat equations in chapter 4 to de-
termine the change in temperature of the soil. The relation-
ship between heat, the mass of the soil, and the temperature LOCAL WIND PATTERNS
change is equation 4.4 in chapter 4.
Considering average conditions, there are two factors that are
5
_
m = 1.6 × 1 0 g Q important for a generalized model to help you understand lo-
Q = mcΔT ∴ ΔT = mc cal wind patterns. These factors are (1) the relationship between
_
cal
c = 0.2 4 air temperature and air density and (2) the relationship between
6.2 × 1 0 cal
g⋅C° ΔT = __
g⋅°C)
cal
(
5
5
energy = 2.6 × 1 0 J (1.6 × 1 0 g) 0.2 _ air pressure and the movement of air.
The upward and downward movement of air leads to the
Convert energy to calorie heat: __ _ second part of the generalized model, that (1) the upward move-
4
6.2 × 1 0
cal
=
(
5
1 cal
_
cal
5
Q = 2.6 × 1 0 J _ ) (1.6 × 1 0 )(0.2) ( g⋅°C) ment produces a “lifting” effect on the surface that results in an
(g)
4.184 J
area of lower atmospheric pressure and (2) the downward move-
4
= 6.2 × 1 0 cal = 1.9 °C ment produces a “piling up” effect on the surface that results in
ΔT = ? an area of higher atmospheric pressure. On the surface, air is
seen to move from the “piled up” area of higher pres sure hori-
zontally to the “lifted” area of lower pressure (Figure 22.9). In
EXAMPLE 22.4
other words, air moves from an area of higher pressure to an
The insolation (I) is a function of the angle between a point directly
area of lower pressure. The movement of air and the pressure
overhead, called the zenith, and the position of the Sun in the sky. This
angle is called the zenith angle, which depends on the latitude, time of
day, and time of year. If the Sun is not directly overhead, the insola-
tion will be less than the maximum amount of insolation on a surface
perpendicular to the Sun (I max ). In this case, the insolation can be cal-
culated by placing a stick in the ground pointing to the zenith and mea-
suring the length of the shadow cast by the Sun. Insolation is the product
of the maximum insolation and the ratio of the length of the stick to
the square root of the sum of the squares of the lengths of the stick and
shadow. The formula is:
L
( )
stick
I = I max __
2
2
√ L + L
shadow
stick
At noon a stick measuring 0.5 m casts a 0.12 m shadow. What is the insola-
2
3
tion? (Assume the maximum insolation on a clear day is 1.0 × 10 W/m .)
2
2
(Answer: 9.8 × 10 W/m .)
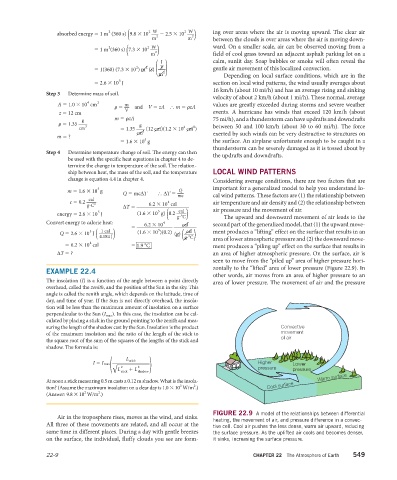
FIGURE 22.9 A model of the relationships between differential
Air in the troposphere rises, moves as the wind, and sinks.
heating, the movement of air, and pressure difference in a convec-
All three of these movements are related, and all occur at the tive cell. Cool air pushes the less dense, warm air upward, reducing
same time in different places. During a day with gentle breezes the surface pressure. As the uplifted air cools and becomes denser,
on the surface, the individual, fluffy clouds you see are form- it sinks, increasing the surface pressure.
22-9 CHAPTER 22 The Atmosphere of Earth 549