
Page 546 - MARSIUM'21 COMP OF PAPER
P. 546
Ng Wai Teng (2021)
B Std. Error Beta
1 (Constant) 2.034 .414 4.916 .000
Brand .136 .120 .133 1.136 .258
Price .241 .131 .229 1.834 .069
Trend .079 .054 .139 1.456 .148
a. Dependent Variable: Consumer Purchasing Intention.
Table 4.5: Multiple Regression – Coefficients
As seen from the result of Multiple Regression in Table 4.6, illustrate that all variables are not significant
towards the continuous, dependent variables due to their significant value are higher than 0.05. Those variables are
Brand (β = 0.136, sig = 0.258) , price (β = 0.241, sig = 0.069) and trend (β = 0.079, sig = 0.148).
Model Summary
Adjusted R Std. Error of the
Model R R Square Square Estimate
1 .417 a .174 .152 .58295
a. Predictors: (Constant), Trend, Brand, Price
Table 4.5: Multiple Regression – R Square
Based on table 4.5, the value of R-square is 0.174, which means that 17.4% of the variance is explained
by the independent variables including of brand, price and trend. Concurrently, an additional 82.6% factors to
consumer purchase intention are derived from another independent variable which is not evaluated in this research.
Meanwhile, the value of adjusted R square is 0.152, which means that 15.2% had been significantly explained by
independent variables in this study.
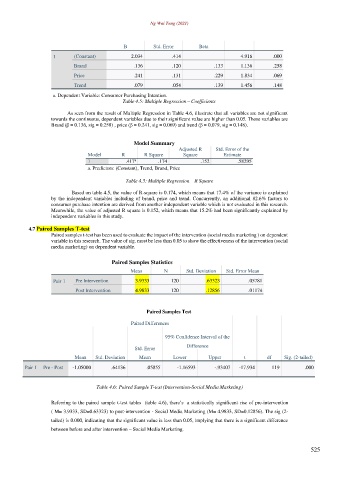
4.7 Paired Samples T-test
Paired samples t-test has been used to evaluate the impact of the intervention (social media marketing ) on dependent
variable in this research. The value of sig. must be less than 0.05 to show the effectiveness of the intervention (social
media marketing) on dependent variable.
Paired Samples Statistics
Mean N Std. Deviation Std. Error Mean
Pair 1 Pre Intervention 3.9333 120 .63323 .05781
Post Intervention 4.9833 120 .12856 .01174
Paired Samples Test
Paired Differences
95% Confidence Interval of the
Difference
Std. Error
Mean Std. Deviation Mean Lower Upper t df Sig. (2-tailed)
Pair 1 Pre - Post -1.05000 .64136 .05855 -1.16593 -.93407 -17.934 119 .000
Table 4.6: Paired Sample T-test (Intervention-Social Media Marketing)
Referring to the paired sample t-test tables (table 4.6), there’s a statistically significant rise of pre-intervention
( M= 3.9333, SD=0.63323) to post-intervention - Social Media Marketing (M= 4.9833, SD=0.12856). The sig (2-
tailed) is 0.000, indicating that the significant value is less than 0.05, implying that there is a significant difference
between before and after intervention – Social Media Marketing.
525