
Page 545 - MARSIUM'21 COMP OF PAPER
P. 545
Ng Wai Teng (2021)
the product is reasonable.
I think a higher price implies
higher quality of a good.
I made purchase to follow up to
the latest trend.
I think I can express my feelings
based on my lifestyles.
Trend 4 0.922 Excellent
Other people influence me to
follow trend.
I feel satisfied when I follow the
trend.
I would like to have more
information of the business
I’m likely to make a purchase
Consumer from the shop
Purchase 4 0.822 High
Intention
I’m interested in the brand of the
business
In the future I’m very likely to
purchase from this business
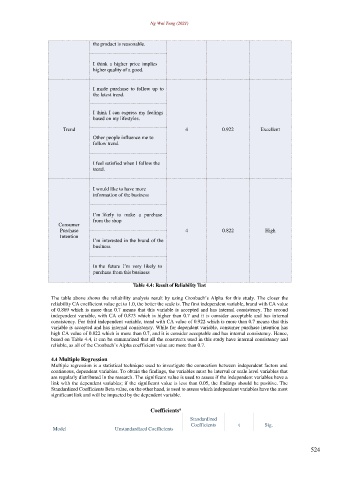
Table 4.4: Result of Reliability Test
The table above shows the reliability analysis result by using Cronbach’s Alpha for this study. The closer the
reliability CA coefficient value get to 1.0, the better the scale is. The first independent variable, brand with CA value
of 0.869 which is more than 0.7 means that this variable is accepted and has internal consistency. The second
independent variable, with CA of 0.873 which is higher than 0.7 and it is consider acceptable and has internal
consistency. For third independent variable, trend with CA value of 0.922 which is more than 0.7 means that this
variable is accepted and has internal consistency. While for dependent variable, consumer purchase intention has
high CA value of 0.822 which is more than 0.7, and it is consider acceptable and has internal consistency. Hence,
based on Table 4.4, it can be summarized that all the constructs used in this study have internal consistency and
reliable, as all of the Cronbach’s Alpha coefficient value are more than 0.7.
4.4 Multiple Regression
Multiple regression is a statistical technique used to investigate the connection between independent factors and
continuous, dependent variables. To obtain the findings, the variables must be interval or scale level variables that
are regularly distributed in the research. The significant value is used to assess if the independent variables have a
link with the dependent variables; if the significant value is less than 0.05, the findings should be positive. The
Standardized Coefficients Beta value, on the other hand, is used to assess which independent variables have the most
significant link and will be impacted by the dependent variable.
a
Coefficients
Standardized
Coefficients t Sig.
Model Unstandardized Coefficients
524