
Page 290 - Basic Course
P. 290
KNX BASIC COURSE
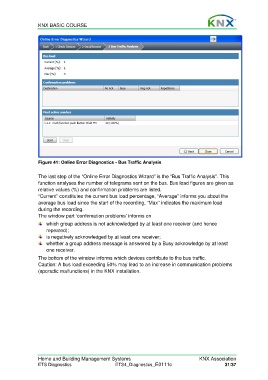
Figure 41: Online Error Diagnostics - Bus Traffic Analysis
The last step of the “Online Error Diagnostics Wizard” is the “Bus Traffic Analysis”. This
function analyses the number of telegrams sent on the bus. Bus load figures are given as
relative values (%) and confirmation problems are listed.
“Current” constitutes the current bus load percentage, “Average” informs you about the
average bus load since the start of the recording, “Max” indicates the maximum load
during the recording.
The window part ‘confirmation problems’ informs on
which group address is not acknowledged by at least one receiver (and hence
repeated);
is negatively acknowledged by at least one receiver;
whether a group address message is answered by a Busy acknowledge by at least
one receiver.
The bottom of the window informs which devices contribute to the bus traffic.
Caution: A bus load exceeding 50% may lead to an increase in communication problems
(sporadic malfunctions) in the KNX installation.
Home and Building Management Systems KNX Association
ETS Diagnostics ETS4_Diagnostics_E0111c 31/37