
Page 21 - GeoPRISMS_Newsletter_Spring2018_Neat
P. 21
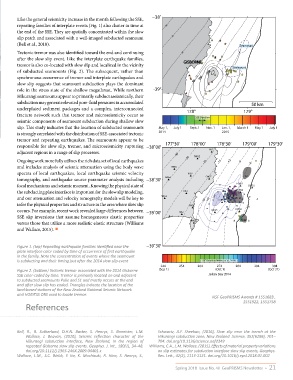
Like the general seismicity increase in the month following the SSE,   −38˚
        repeating families of interplate events (Fig. 1) also cluster in time at   -40
        the end of the SSE. They are spatially concentrated within the slow
        slip patch and associated with a well-imaged subducted seamount   -30
        (Bell et al., 2010).                                                                         Seamount
        Tectonic tremor was also identified toward the end and continuing    -20
        after the slow slip event. Like the interplate earthquake families,
        tremor is also co-located with slow slip and localized in the vicinity   GISBORNE         Seamount
                                                                                -15
        of subducted seamounts (Fig. 2). The subsequent, rather than                    200
        synchronous occurrence of tremor and interplate earthquakes and            -12  100
        slow slip suggests that seamount subduction plays the dominant            50
        role in the stress state of the shallow megathrust. While northern   -39°      -9
        Hikurangi seamounts appear to primarily subduct aseismically, their
        subduction may generate elevated pore-fluid pressures in accumulated                              50 km
        underplated sediment packages and a complex, interconnected            178°                    179°
        fracture network such that tremor and microseismicity occur as             SSE Duration
        seismic components of seamount subduction during shallow slow
        slip. This study indicates that the location of subducted seamounts   May 1,   July 1  Sept. 1  Nov. 1  Jan. 1,  March 1  May 1  July 1
        is strongly correlated with the distribution of SSE-associated tectonic   2014        2015
        tremor and repeating earthquakes. The seamounts appear to be
        responsible for slow slip, tremor, and microseismicity rupturing  −38˚00'  177°30’  178°00’  178°30’  179°00’  179°30’
        adjacent regions in a range of slip processes.                    −40           PUZ
        Ongoing work more fully utilizes the rich data set of local earthquakes   −30  TWGZ  −20  −15  −12  −9
        and includes analysis of seismic attenuation using the body wave   MWZ                            −6
        spectra of local earthquakes, local earthquake seismic velocity        TKGZ
        tomography, and earthquake source parameter analysis including  −38˚30'  RAGZ  CNGZ            S2
                                                                                                    OBB
        focal mechanisms and seismic moment. Knowing the physical state of                          LOBS1  LOBS2
        the subducting plate interface is important for the slow slip modeling,   RIGZ          EOBS3 EOBS4
                                                                                                    E
                                                                                                    EO
                                                                                                EO
                                                                                                 O O
                                                                                                 EOBS1 11
                                                                                               OB
        and our attenuation and velocity tomography models will be key to   SNGZ      50 50  100 100  200 200 200  LOBSBS  EOBS2 2  S1
                                                                                            LOBS8
        infer the physical properties and structure in the area where slow slip   PRGZ
        occurs. For example, recent work revealed large differences between   −39˚00'  KNZ  EOBS5  LOBS6
                                                                                                    OB
        SSE slip inversions that assume homogeneous elastic properties
        versus those that utilize a more realistic elastic structure (Williams   MHGZ                 PUKE
        and Wallace, 2015). ■
        Figure 1. (top) Repeating earthquake families identified near the   −39˚30'
        plate interface color coded by time of occurrence of first earthquake
        in the family. Note the concentration of events where the seamount
        is subducting and their timing just after the 2014 slow slip event            SSE Duration (Wallace et al., 2016)
                                                                    244     254     264     274    284     294     304
        Figure 2. (bottom) Tectonic tremor associated with the 2014 Gisborne   (Sep 1)     (Oct 1)               (Oct 31)
        SSE color-coded by time. Tremor is primarily located on and adjacent            Julian Day 2014
        to subducted seamounts Puke and S1 and mostly occurs at the end
        and after slow slip has ended. Triangles indicate the location of the
        land-based stations of the New Zealand National Seismic Network
        and HOBITSS OBS used to locate tremor.
                                                                                          NSF GeoPRISMS Awards # 1551683 ,
                                                                                                       1551922, 1551758
            References


        Bell,  R.,  R.  Sutherland,  D.H.N.  Barker,  S.  Henrys,  S.  Bannister,  L.M.   Schwartz,  A.F.  Sheehan,  (2016),  Slow  slip  near  the  trench  at  the
            Wallace,  J.  Beavan,  (2010),  Seismic  reflection  character  of  the   Hikurangi subduction zone, New Zealand. Science, 352(6286), 701–
            Hikurangi  subduction  interface,  New  Zealand,  in  the  region  of   704. doi.org/10.1126/science.aaf2349
            repeated Gisborne slow slip events. Geophys. J. Int., 180(1), 34–48.   Williams, C.A., L.M. Wallace, (2015), Effects of material property variations
            doi.org/10.1111/j.1365-246X.2009.04401.x               on slip estimates for subduction interface slow slip events, Geophys.
        Wallace,  L.M.,  S.C.  Webb,  Y.  Ito,  K.  Mochizuki,  R.  Hino,  S.  Henrys,  S.,   Res. Lett., 42(2), 1113-1121. doi.org/10.1016/j.epsl.2018.01.002

                                                                          Spring 2018  Issue No. 40  GeoPRISMS Newsletter  •  21