
Page 56 - analysis-and-interpretation-of-astronomical-sp
P. 56
Analysis and Interpretation of Astronomical Spectra 56
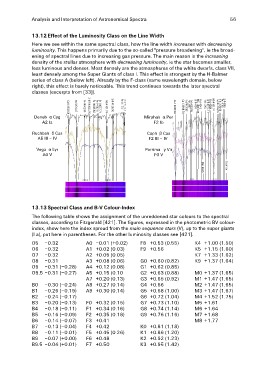
13.12 Effect of the Luminosity Class on the Line Width
Here we see within the same spectral class, how the line width increases with decreasing
luminosity. This happens primarily due to the so-called "pressure broadening", ie the broad-
ening of spectral lines due to increasing gas pressure. The main reason is the increasing
density of the stellar atmosphere with decreasing luminosity, ie the star becomes smaller,
less luminous and denser. Most densely are the atmospheres of the white dwarfs, class VII,
least densely among the Super Giants of class I. This effect is strongest by the H-Balmer
series of class A (below left). Already by the F-class (same wavelength domain, below
right), this effect is barely noticeable. This trend continues towards the later spectral
classes (excerpAtsusfrwomirk[u3n3g]).der Leuchtkraftklassen (LuminosAituysewffierkcut)nagudfeSrpLeekutrcahltkypraAftklasse (Lumin
Hγ 4340.47
DenDeAeb2neAlαab2CIαyagCyg Fe l 4326
RucRhubcahhbaδh CδaCsas Sc ll/Ti ll 4314
CH/Fe ll 4299-13
A5AI5II-IIIVI – IV
VegaVeαgaLyαr Lyr TAFCrELl/Ti ll224290
Fe l 4271-72
A0 VA0 V Zr ll 4258
Sc ll 4247
Fe ll 4231-33
Sr ll 4215.52
FFeel/lVl/lCl r4l2406266
Y ll/V ll/Fe ll 4177-79
FeFlel/Tlli4ll643147.62-73
ZFCFrerelllll44l41146446193279/1.99
HFSCFeiδerllll/4ll4lll141440525118881./83783/.40822
FSFeer llll44005875470.71
Fe l 4064
FFee lll44054250/23
MZTFFMTrieeinglllllll3444l4l900445092074037420811/01.-23576
TCFeialll/II4Y3l4l 943694883.74
Fe ll 4416.8
TCiallI4I 339953.30.466
Fe ll 4384-85
Fe ll 4366.17
Fe ll 4352
Hγ 4340.47
Sc ll/Ti ll 4314
Fe ll 4303.2
Fe l 4271-72
Fe ll 4233.17
Ca I 4226.73
Fe ll 4178.9
Fe l 4173.1
Si ll 4128/30
Hδ 4101.74
Sr ll 4077.71
Fe l 4067.6
Fe l 4045.82
Zr ll/Ti ll 4024/28
Fe l 4002/05
Hε 3970.07
Ca II 3933.66
Mirphak α Per
F2 Ib Ca I 4226.73
Ti ll 4154
Mirphak α Per
Mn l 4055
FC2aplbh β Cas
CaphF2β ICIIa–sIV
F2lll-lV
Porrima γ Vir
Porrima Fγ0VVir
F0 V
RuDDcVeehennbgeeaabbh
Vega
©Richard Walker 2010/05
13.13 Spectral Class and B-V Colour-Index
The following table shows the assignment of the unreddened star colours to the spectral
classes, according to Fitzgerald [421]. The figures, expressed in the photometric BV colour-
index, show here the index spread from the main sequence stars (V), up to the super giants
(I a), put here in parentheses. For the other luminosity classes see [421].
O5 –0.32 A0 –0.01 (+0.02) F8 +0.53 (0.55) K4 +1.00 (1.50)
O6 –0.32 A1 +0.02 (0.03) F9 +0.56 K5 +1.15 (1.60)
O7 –0.32 A2 +0.05 (0.05) G0 +0.60 (0.82) K7 +1.33 (1.62)
O8 –0.31 A3 +0.08 (0.06) G1 +0.62 (0.85) K9 +1.37 (1.64)
O9 –0.31 (–0.28) A4 +0.12 (0.08) G2 +0.63 (0.88) M0 +1.37 (1.65)
O9.5 –0.31 (–0.27) A5 +0.15 (0.10 G3 +0.65 (0.92) M1 +1.47 (1.65)
B0 –0.30 (–0.24) A7 +0.20 (0.13) G4 +0.66 M2 +1.47 (1.65)
B1 –0.26 (–0.19) A8 +0.27 (0.14) G5 +0.68 (1.00) M3 +1.47 (1.67)
B2 –0.24 (–0.17) A9 +0.30 (0.14) G6 +0.72 (1.04) M4 +1.52 (1.75)
B3 –0.20 (–0.13) F0 +0.32 (0.15) G7 +0.73 (1.10) M5 +1.61
B4 –0.18 (–0.11) F1 +0.34 (0.16) G8 +0.74 (1.14) M6 +1.64
B5 –0.16 (–0.09) F2 +0.35 (0.18) G9 +0.76 (1.16) M7 +1.68
B6 –0.14 (–0.07) F3 +0.41 K0 +0.81 (1.18) M8 +1.77
B7 –0.13 (–0.04) F4 +0.42 K1 +0.86 (1.20)
B8 –0.11 (–0.01) F5 +0.45 (0.26) K2 +0.92 (1.23)
B9 –0.07 (+0.00) F6 +0.48 K3 +0.95 (1.42)
B9.5 –0.04 (+0.01) F7 +0.50