
Page 55 - analysis-and-interpretation-of-astronomical-sp
P. 55
Analysis and Interpretation of Astronomical Spectra 55
F- Class: H- Balmer lines become weaker, H+K lines Ca II, neutral and singly ionised metal
lines become stronger (Fe I, Fe II, Cr II, Ti II). The striking “line double” of G-Band (CH mo-
lecular) and Hγ line can only be seen here and forms the unmistakable "Brand" of the mid-
dle F-class [33]!
Examples: Caph (Beta Cassiopeiae): F2III-IV, Mirphak (Alpha Persei): F5 Ib,
Polaris: F7 Ib-II, Sadr (Gamma Cygni): F8 Ib, Procyon: F5 IV-V
G- Class: Fraunhofer H+K lines Ca II very strong, H- Balmer lines get further weaker, Fraun-
hofer G- Band becomes stronger as well as many neutral metal lines eg Fe I, Fraunhofer D-
line (Na I).
Examples: Sun: G2V, the brighter component of Alpha Centauri G2V, Mufrid (Eta Bootis):
G0 IV, Capella G5IIIe + G0III (binary star composite spectrum).
K- Class: Is dominated by metal lines, H- Balmer lines get very weak,
Fraunhofer H+K Ca II are still strong, Ca I becomes strong now as well as the molecular
lines CH,CN. By the late K- types first appearance of TiO bands.
Examples: Pollux: K0IIIb, Arcturus: K1.5 III Fe, Hamal (Alpha Arietis): K2 III Ca, Alde-
baran: K5 III
M- Class: Molecular TiO- bands get increasingly dominant, many strong neutral metal lines,
eg Ca I. Maximum intensity of the continuum is in the IR range.
Examples: Mirach (Beta Andromedae): M0 IIIa, Betelgeuse: M1-2 Ia-Iab, Antares:
M1.5 Iab-b, Menkar (Alpha Ceti): M 1.5 IIIa, Scheat, (Beta Pegasi): M3 III Tejat Posterior
(mü Gemini): M3 III Ras Algheti: (Alpha Herculis): M5III
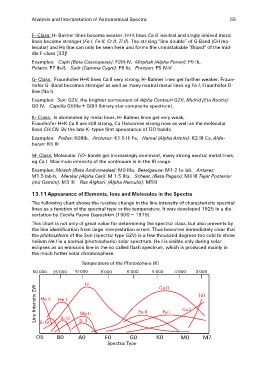
13.11 Appearance of Elements, Ions and Molecules in the Spectra
The following chart shows the relative change in the line intensity of characteristic spectral
lines as a function of the spectral type or the temperature. It was developed 1925 in a dis-
sertation by Cecilia Payne Gaposhkin (1900 – 1979).
This chart is not only of great value for determining the spectral class, but also prevents by
the line identification from large interpretation errors. Thus becomes immediately clear that
the photosphere of the Sun (spectral type G2V) is a few thousand degrees too cold to show
helium He l in a normal (photospheric) solar spectrum. He I is visible only during solar
eclipses as an emission line in the so called flash spectrum, which is produced mainly in
the much hotter solar chromosphere.
Temperature of the Photosphere (K)
50‘000 25‘000 10‘000 8‘000 6‘000 5‘000 4‘000 3‘000
Line Intensity EW H Ca II
He II He I
TiO
Mg II
Si IV Si III Si II Fe II Fe I Ca I
O5 B0 A0 F0 G0 K0 M0 M7
Spectral Type