
Page 57 - analysis-and-interpretation-of-astronomical-sp
P. 57
Analysis and Interpretation of Astronomical Spectra 57
14 The Hertzsprung - Russell Diagram (HRD)
14.1 Introduction to the Basic Version
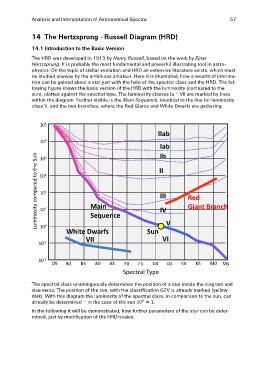
The HRD was developed in 1913 by Henry Russell, based on the work by Ejnar
Hertzsprung. It is probably the most fundamental and powerful illustrating tool in astro-
physics. On the topic of stellar evolution and HRD an extensive literature exists, which must
be studied anyway by the ambitious amateur. Here it is illustrated, how a wealth of informa-
tion can be gained about a star just with the help of the spectral class and the HRD. The fol-
lowing figure shows the basic version of the HRD with the luminosity (compared to the
sun), plotted against the spectral type. The luminosity classes Ia – VII are marked by lines
within the diagram. Further visible is the Main Sequence, identical to the line for luminosity
class V, and the two branches, where the Red Giants and White Dwarfs are gathering.
Luminosity compared to the Sun 106
IIab
105
Iab
104 Ib
II
103
102 III Red
Giant Branch
101 Main IV
Sequence
V
100 Sun
White Dwarfs VI
10-1 VII
10-2 O5 B0 B5 A0 A5 F0 F5 G0 G5 K0 K5 M0 M5
Spectral Type
The spectral class unambiguously determines the position of a star inside the diagram and
vice versa. The position of the sun, with the classification G2V is already marked (yellow
disk). With this diagram the luminosity of the spectral class, in comparison to the sun, can
already be determined – in the case of the sun
In the following it will be demonstrated, how further parameters of the star can be deter-
mined, just by modification of the HRD-scales.