
Page 223 - Applied Statistics with R
P. 223
11.4. PARAMETERIZATION 223
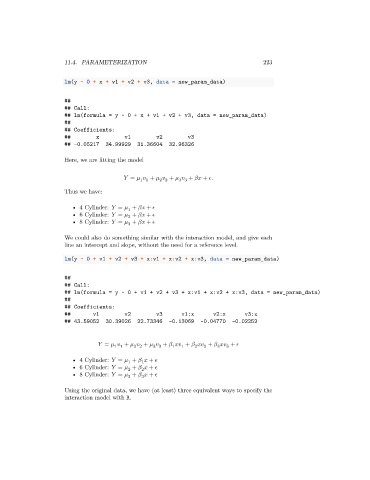
lm(y ~ 0 + x + v1 + v2 + v3, data = new_param_data)
##
## Call:
## lm(formula = y ~ 0 + x + v1 + v2 + v3, data = new_param_data)
##
## Coefficients:
## x v1 v2 v3
## -0.05217 34.99929 31.36604 32.96326
Here, we are fitting the model
= + + + + .
1 1
2 2
3 3
Thus we have:
• 4 Cylinder: = + +
1
• 6 Cylinder: = + +
2
• 8 Cylinder: = + +
3
We could also do something similar with the interaction model, and give each
line an intercept and slope, without the need for a reference level.
lm(y ~ 0 + v1 + v2 + v3 + x:v1 + x:v2 + x:v3, data = new_param_data)
##
## Call:
## lm(formula = y ~ 0 + v1 + v2 + v3 + x:v1 + x:v2 + x:v3, data = new_param_data)
##
## Coefficients:
## v1 v2 v3 v1:x v2:x v3:x
## 43.59052 30.39026 22.73346 -0.13069 -0.04770 -0.02252
= + + + + + +
3 3
2 2
1
1
3
3
2
1 1
2
• 4 Cylinder: = + +
1
1
• 6 Cylinder: = + +
2
2
• 8 Cylinder: = + +
3
3
Using the original data, we have (at least) three equivalent ways to specify the
interaction model with R.